What are the IEC 60599 gas ratios?
They are three ratios of dissolved gases, C2H2/C2H4, CH4/H2 and C2H4/C2H6, that IEC 60599:2022 uses to identify six classes of fault in oil-filled equipment: partial discharges, low and high energy discharges, and thermal faults below 300 °C, between 300 and 700 °C, and above 700 °C. The standard calculates them only after at least one gas is above its typical concentration and rate of increase.
Ratios are the oldest idea in dissolved gas analysis and still the most misunderstood. Every fault produces a mixture of gases, never a single one, and the mixture shifts with the energy and the temperature involved. A ratio between two gases cancels the absolute quantity and keeps the shape of the mixture, which is what points to the type of fault.
IEC 60599:2022, the fourth edition of the IEC guide to interpreting dissolved and free gas analysis, turns that idea into a short table. It is precise about when the table applies, and just as precise about when it does not. Most errors made with gas ratios come from skipping the second part.
On this page (9 sections)
Which three ratios does IEC 60599 use?
Clause 4.1 of the standard explains the chemistry. Breaking a carbon-hydrogen bond takes the least energy, so cold plasma discharges leave mostly hydrogen. Breaking carbon-carbon bonds takes more, and the gas formed depends on how much: ethylene is favoured above roughly 500 °C, while acetylene needs 800 to 1 200 °C and fast quenching, which in practice means an arc. Each ratio sets two of these gases against each other.
| Ratio | Gases compared | What it separates |
|---|---|---|
| C2H2/C2H4 | Acetylene over ethylene | Discharges, where acetylene is formed in arcs, from thermal faults, where it stays low |
| CH4/H2 | Methane over hydrogen | Partial discharges, dominated by hydrogen, from heating, where methane grows |
| C2H4/C2H6 | Ethylene over ethane | The temperature of a thermal fault: the hotter the fault, the more ethylene |
A note to Table 1 records that in some countries C2H2/C2H6 is used in place of CH4/H2, and that some countries use slightly different limits. The method is a convention agreed in IEC TC 10, not a law of chemistry, and a report should always say which version it applies.
How do the ratios point to a fault?
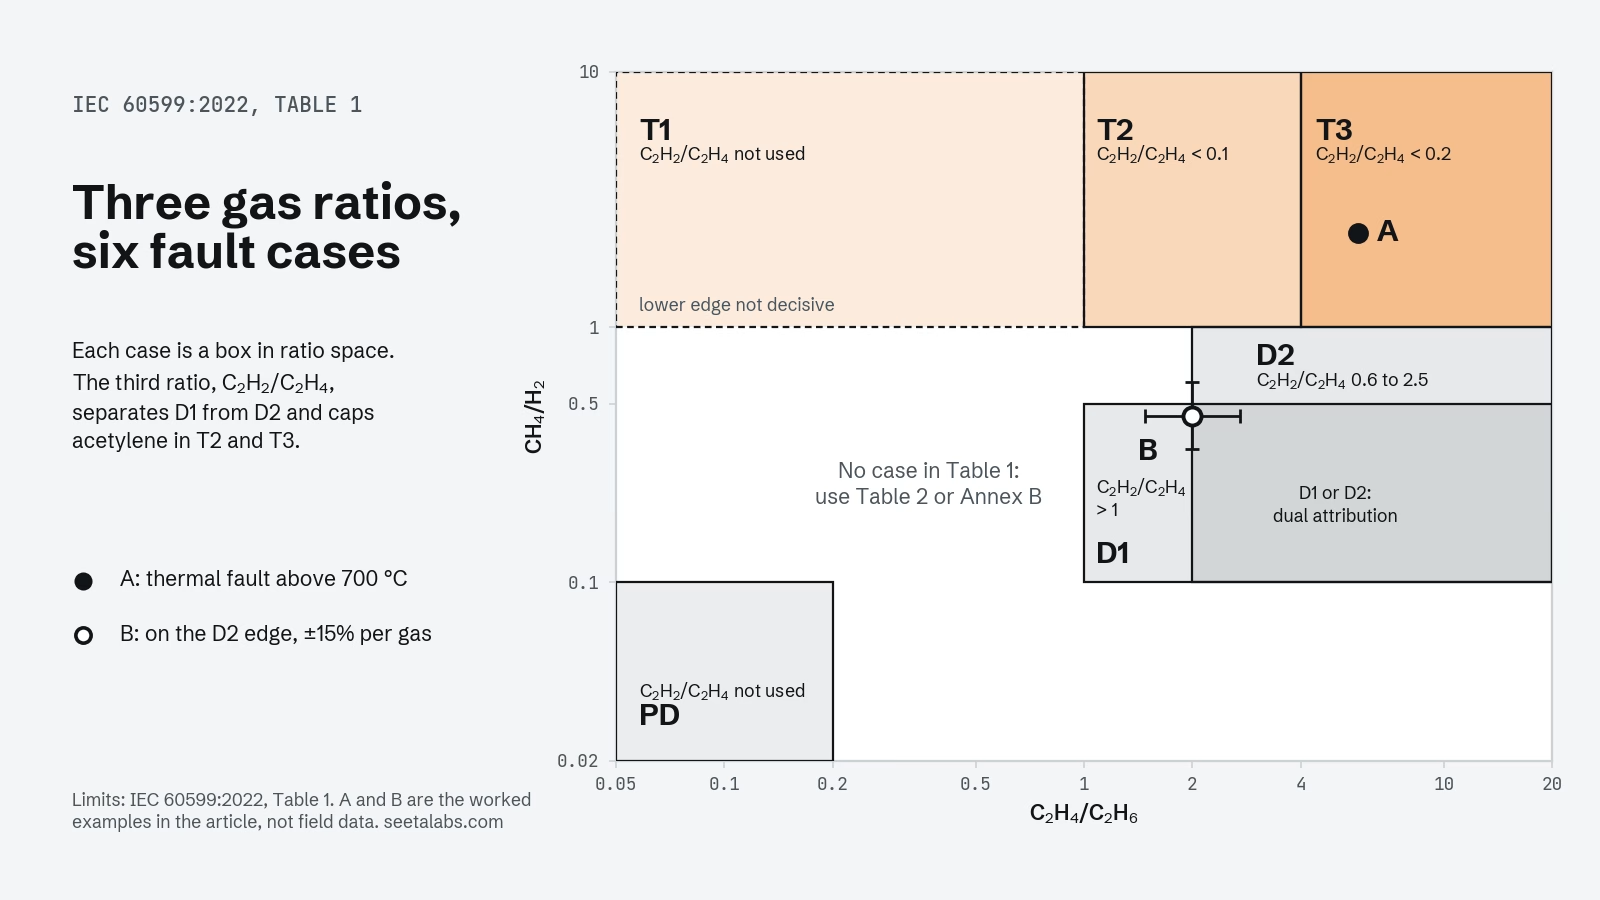
Table 1 of the standard combines the three ratios into six cases, named after the fault classes found by internal inspection of hundreds of faulty units (clause 5.3). Each case is a box of value ranges. A sample falls in a case only if all three ratios fall in that case’s ranges, and some ratios are declared non-significant for some cases. The summary below follows the standard’s limits; the full table, with its four notes, is in IEC 60599:2022.
| Case | Fault, as defined in clause 5.3 | Signature in the three ratios |
|---|---|---|
| PD | Partial discharges of the cold plasma (corona) type, possibly leaving X-wax on paper | Very little methane against hydrogen (CH4/H2 below 0.1) and little ethylene against ethane (below 0.2); acetylene is not considered |
| D1 | Low energy discharges: tracking, small punctures in paper, sparking | Acetylene above ethylene (C2H2/C2H4 above 1), CH4/H2 between 0.1 and 0.5, C2H4/C2H6 above 1 |
| D2 | High energy discharges with power follow-through, extensive carbonisation, metal fusion | C2H2/C2H4 between 0.6 and 2.5, CH4/H2 between 0.1 and 1, C2H4/C2H6 above 2 |
| T1 | Thermal fault below 300 °C, paper turned brownish | Ethylene below ethane (C2H4/C2H6 below 1); CH4/H2 usually above 1 but not decisive, and acetylene is not considered |
| T2 | Thermal fault between 300 and 700 °C, paper carbonised | Almost no acetylene (C2H2/C2H4 below 0.1), CH4/H2 above 1, C2H4/C2H6 between 1 and 4 |
| T3 | Thermal fault above 700 °C, oil carbonised, metal coloured or fused | C2H2/C2H4 below 0.2, CH4/H2 above 1, C2H4/C2H6 above 4; rising acetylene can mean a hot spot above 1 000 °C |
The ranges of D1 and D2 overlap, and the standard says so: some results deserve a dual attribution, D1 or D2. The distinction is kept because the energy in the discharge changes how much damage it can do and what the operator should do next. The same caution applies to partial discharges: stray gassing of oil at moderate temperatures can produce a pattern that looks like PD (note 4 to Table 1, clause 4.3).
For other equipment the limits move. Partial discharges show CH4/H2 below 0.2 in instrument transformers and below 0.07 in bushings (note 3). Tap changer compartments follow their own rules, covered below.
When should you not calculate the ratios at all?
This is the part of the method that is skipped most often. Clause 6.1 c) states that ratios are significant, and should be calculated, only when at least one gas is above its typical concentration and its typical rate of increase. Below that, gas is the product of normal ageing, and a ratio computed on it describes noise. Clause 9 makes the order explicit: check the data, compare with the previous sample and with typical values, and only then calculate ratios.
| Condition | What IEC 60599:2022 says | Clause |
|---|---|---|
| All gases below typical values and rates | Report as normal DGA, healthy equipment. Ratios are not significant | 9 a), A.2.3 |
| A value of 0 or below the detection limit S | Report it as “below the S value for this gas”, never as zero | 6.1 a) |
| Gases above typical values but below 10 times S | Use the ratios with caution: uncertainty is about ±15% above 10 × S and rises to about ±30% at 5 × S | 6.2 |
| Ratios different from the previous sample | A new fault may sit on top of an old one: subtract the previous values and recalculate | 6.1 d) |
| Large, inconsistent changes over days or weeks | Suspect sampling or analysis before suspecting the transformer | 6.1 b) |
| Communicating tap changer, C2H2/H2 above 2 to 3 | Probable contamination from the tap changer: Table 1 does not apply, or applies only after subtracting it | 5.7, A.2.3 |
Typical values are not limits. Annex A gives ranges of 90% typical concentrations reported by about 25 networks and more than 20 000 power transformers, for example 50 to 150 µl/l for hydrogen and 60 to 280 µl/l for ethylene. The standard asks each network to compute its own and to use the published ranges only by default. Our guide to normal dissolved gas levels explains how IEEE C57.104-2019 builds the equivalent screening on statistics conditioned by age and the O2/N2 ratio.
What if the ratios match no case?
It happens often, and it is not a failure of the laboratory. A note to clause 5.4 says that combinations outside the table can be a mixture of faults, or a new fault on top of a high background. Table 1 then gives no diagnosis. The standard offers two fallbacks. Table 2, a simplified scheme, separates only three families: CH4/H2 below 0.2 points to partial discharges, C2H2/C2H4 above 0.2 to discharges, and below 0.2 to a thermal fault. And the graphical representations of Annex B show which case is closest to the point.
One of those representations is Duval’s Triangle 1, Figure B.3 of the same standard. The standard notes that it always gives a diagnosis, which is useful for cases outside Table 1 and also the reason it should be used only when other evidence says a fault is likely. Our guide to reading the Duval Triangle covers the coordinates and the limits of its zones.
Two worked examples
The numbers below are examples built for this guide, not results from a real transformer. Both assume a power transformer without a communicating tap changer and a previous sample, six months earlier, with clearly lower values, so that concentrations and rates are both above typical.
| Gas, µl/l | Example A | Example B |
|---|---|---|
| H2 | 120 | 200 |
| CH4 | 280 | 90 |
| C2H6 | 90 | 30 |
| C2H4 | 520 | 60 |
| C2H2 | 3 | 40 |
| C2H2/C2H4 | 0.006 | 0.67 |
| CH4/H2 | 2.3 | 0.45 |
| C2H4/C2H6 | 5.8 | 2.0 |
| Table 1 | T3, thermal fault above 700 °C | No case |
| Table 2 | T | D, discharge |
| Triangle 1 (%CH4, %C2H4, %C2H2) | 34.9, 64.8, 0.4: zone T3 | 47.4, 31.6, 21.1: zone D2 |
Example A is the easy case. All three ratios sit well inside the T3 box, far from any boundary, and the triangle agrees. Even a 30% error on the 3 µl/l of acetylene would leave C2H2/C2H4 below 0.01. The next questions are the ones clause 9 b) asks: are values above alarm levels, is the fault evolving, is paper involved?
Example B is the instructive one. C2H2/C2H4 and CH4/H2 both fit D2, but C2H4/C2H6 is exactly 2.0, and D2 asks for more than 2. A few microlitres of ethane either way would move the sample in or out of the case. With the ±15% the standard expects on each value, the code is not stable, and reporting “D2” as if it were would claim a precision the data do not have. Table 2 and the triangle both say discharge, and the honest report says that: discharge, probably high energy, confirm with the trend and with the history of the unit. The way laboratory uncertainty moves results near zone boundaries is the subject of our analysis of Duval zone stability.
Which other ratios matter?
Three more ratios appear in IEC 60599:2022. None of them identifies a fault type on its own, but each changes how the main three should be read.
| Ratio | What it indicates | Caution in the standard |
|---|---|---|
| CO2/CO | Below 3, with CO high (for example 1 000 µl/l) and other fault gases present: probable paper involvement. Above 10, with CO2 above 10 000 µl/l: mild overheating of paper below 160 °C, or oil oxidation | Correct first for CO2 from air and for background values. Paper involvement is never decided on CO and CO2 alone (clause 5.5) |
| O2/N2 | About 0.5 at equilibrium with air. Below 0.3, except in closed systems: excessive oxygen consumption by oxidation or paper ageing | Load and preservation system also affect it |
| C2H2/H2 | Above 2 to 3 in the main tank: probable contamination from a communicating tap changer | Confirm by comparing samples from main tank, tap changer and conservators |
For the tap changer compartment itself, Annex A.7 is clear that arcing gases are normal operation for most non-vacuum designs. The standard uses two tools there: the C2H4/C2H2 ratio as a fingerprint of the specific model, with normal ranges set by the user, and Duval’s Triangle 2. Our article on tap changer DGA and triangle zones goes into that case.
What happened to the Rogers ratios?
The name survives in many reports, but not in IEC 60599. The 2022 edition never cites Rogers. It keeps three ratios, six cases and the explicit rule on when to calculate them. The Rogers method in its classic form used four ratios, including C2H6/CH4, which is not part of the IEC table.
IEEE C57.104-2019, the American guide for mineral oil transformers, still presents a “Rogers Ratios Method” in clause 6.2.2. Its Table 5 uses the same three ratios as IEC with different limits and five fault cases plus a “unit normal” case. The guide states the method’s main weakness plainly: it cannot identify a fault in a relatively large number of results, typically 35%, even when gas levels are high and a fault is obvious. Both guides warn against using ratio methods on samples with very low gas levels.
| IEC 60599:2022 | IEEE C57.104-2019, Rogers Ratios | |
|---|---|---|
| Ratios | C2H2/C2H4, CH4/H2, C2H4/C2H6 | The same three |
| Fault cases | Six: PD, D1, D2, T1, T2, T3 | Five, plus “unit normal” |
| When to calculate | Only when at least one gas exceeds typical concentration and rate | Only when values are reliable and accurate enough (clauses 5.2 and 6.2.1) |
| Cases outside the table | Table 2 and the Annex B graphics, including Triangle 1 | Typically 35% of results get no diagnosis; Duval Triangle 1 and the methods of Annex D are offered |
| Fluids | Mineral oil; for esters and silicones the zone limits change (Annex A.8) | Mineral oil only |
If a laboratory report says “Rogers”, ask which table it means. The same three ratios with IEEE limits and the same ratios with IEC limits can give different answers on the same sample.
What a ratio result is, and what it is not
A ratio code names the most likely type of fault for the gas that is there. It does not say how severe the fault is, where it is, or how fast it is growing. Severity comes from concentrations and rates compared with alarm values, which the standard leaves to users, manufacturers and experts with experience of similar equipment (clause 8.2.4). Location and urgency come from the history of the unit, complementary tests and engineering judgement. Clause 9 c) lists the responses in order: sample more often, consider acoustic, electrical or infrared tests or reduced loading, consider inspection, and act immediately when alarm values are exceeded.
Read that way, the ratios are a strong tool. They are cheap, transparent and repeatable, anyone can recompute them from a laboratory report, and the standard tells you exactly when to trust them. For the full sequence from sample to decision, start from our standards-based guide to dissolved gas analysis, and to check a sample of your own, the DGA calculator runs in the browser.
Sources
- IEC 60599:2022, Mineral oil-filled electrical equipment in service: Guidance on the interpretation of dissolved and free gases analysis, edition 4.0, IEC webstore.
- IEEE Std C57.104-2019, IEEE Guide for the Interpretation of Gases Generated in Mineral Oil-Immersed Transformers, IEEE Standards Association.
- IEC 60567:2023, Oil-filled electrical equipment: Sampling of free gases and analysis of free and dissolved gases in mineral oils and other insulating liquids, IEC webstore.
- CIGRE Technical Brochure 771, Advances in DGA interpretation, 2019, e-cigre.
- R. R. Rogers, IEEE and IEC codes to interpret incipient faults in transformers, using gas in oil analysis, IEEE Transactions on Electrical Insulation, EI-13(5), 1978, doi:10.1109/TEI.1978.298141.