When an online DGA monitor and the laboratory disagree, which result is correct?
Neither result can be assumed correct from the difference alone. First make the pair comparable: sampling location and time, units, fluid and the reported gas-volume temperature base, then check sample handling, laboratory quality controls and monitor response. A gas-in-oil standard, as in the CIGRE TB 783 Appendix F procedure, checks the laboratory contribution before assessing the monitor, and a changed Duval zone does not by itself prove which source is wrong.
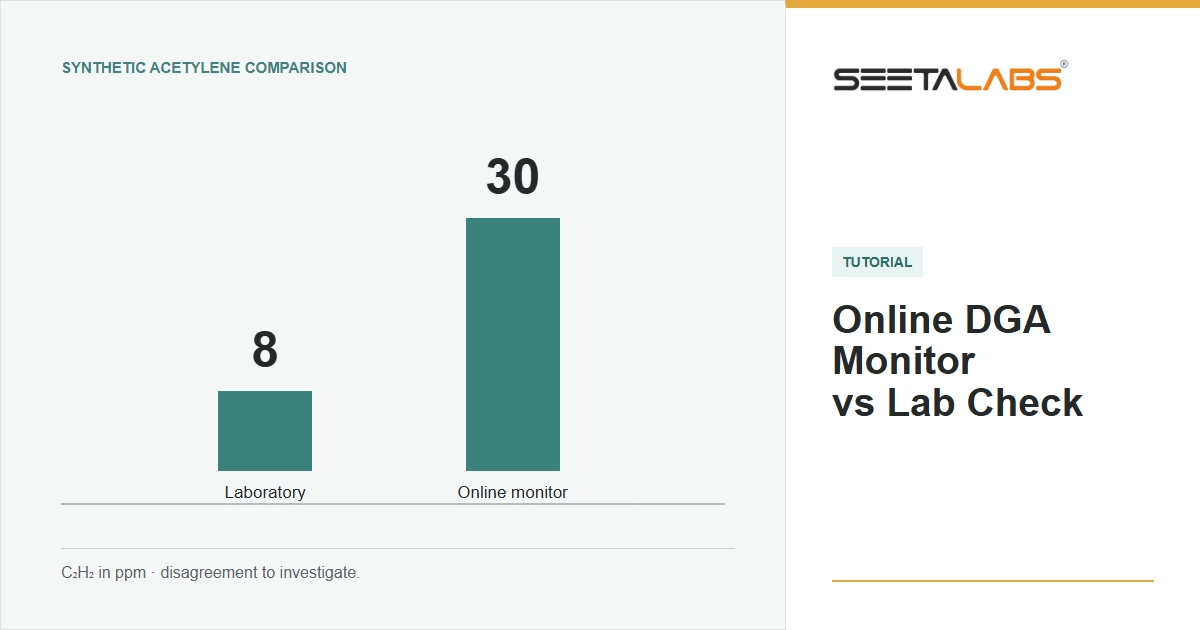
The laboratory reports 8 ppm acetylene; the online monitor reports 30 ppm. That is a 275% difference relative to the laboratory. It deserves investigation, but it does not tell you which measurement is correct. Sample handling, the monitor's response and the analytical chain all matter.
Seetalabs® Online DGA Monitor vs Lab Check version 1.0.4 (October 2026) separates two questions: how far apart are the reported concentrations, and does that difference change the diagnostic result? A gas-in-oil standard (GIOS) adds a reference for checking the laboratory contribution before assessing the monitor. It is not a reason to treat every laboratory result as ground truth.
Make the pair comparable first
Record the sampling location and time, monitor reading time, measured gases, units, fluid and reporting bases. Investigate whether a rapid change or transport delay could mean the two readings represent different oil conditions. Check sample collection, storage and laboratory quality controls, not only the monitor calibration.
The temperature base here describes the reported gas volume. It is not the oil temperature at sampling. The software converts between bases using ppm_2 = ppm_1 * (T2 + 273.15) / (T1 + 273.15). This assumes otherwise compatible reporting conventions; it does not correct pressure differences or reconstruct oil-gas equilibrium. A certificate reported at 0 C and a monitor reported at 25 C must not be compared as if both were already on a 20 C basis.
CIGRE TB 783 discusses sampling, gas-volume bases and laboratory uncertainty, and Appendix F describes the reference-standard procedure. IEC 60567 covers the sampling of free gases and the analysis of free and dissolved gases; since its 2011 edition, which the tool cites, oil sampling has been described in IEC 60475. The current edition is IEC 60567:2023, whose public scope refers oil sampling to IEC 60475:2022. Neither a catalogue summary nor a software label establishes a universal monitor acceptance tolerance. CIGRE TB 783, IEC 60567:2023.
Read the gas rows before the headline
For numeric paired results, the quick comparison computes D = 100 * (monitor - laboratory) / laboratory. The laboratory is the denominator, not a certified true value. A zero denominator is not evaluable. Missing gases and results such as <0.5 are not substituted with zero for this calculation.
The tool selects a concentration band using the larger of the two readings, after conversion. Gas-specific minimum evaluation levels apply first, taken from the minimum values for evaluation in CIGRE TB 783 App. Table G.1: for example, a gas is not evaluated when both readings of hydrogen are below 10 ppm or both readings of methane are below 2 ppm. These are evaluation thresholds, not proof of a particular instrument's detection capability.
The 15 and 30 percent figures come from the "IEC Spec" column of CIGRE TB 783 App. Table E.1, which states laboratory accuracy above 100 ppm and below 8 ppm; elsewhere the brochure applies the IEC 15 percent figure to monitor accuracy measured with its Appendix F procedure. The tool reuses these figures as agreement bands for a direct monitor-laboratory difference: at an eligible level of at least 100 ppm it uses 15 percent, below 8 ppm 30 percent. Between 8 ppm inclusive and 100 ppm exclusive, where the brochure gives no figure, it reports agreement through 15 percent, requests a check above 30 percent, and leaves the interval between undecided. This reuse, the intermediate rule, the boundary handling and the use of the larger reading are choices made by the tool. Do not present them as a complete normative acceptance test.
Methane at 48 ppm from the monitor versus 40 ppm from the laboratory produces a 20% difference, an undecided gas row and the summary "Not decided". With no evaluable paired gases, the summary is "Not enough data". An agreement summary can still coexist with missing or excluded gases when other gases agree: inspect coverage and the individual rows. These summaries describe the comparison, not a service decision.
A disagreement that changes the diagnostic result
Consider a synthetic mineral-oil main-tank example, with all concentrations already on the same 20 C basis. Both sources report H2 120, CH4 40, C2H6 15, CO 300 and CO2 2500 ppm. The laboratory reports C2H4 60 and C2H2 8 ppm; the monitor reports C2H4 25 and C2H2 30 ppm. Oxygen and nitrogen are absent from this example, not zero.
Ethylene differs by 100 * (25 - 60) / 60 = -58.33%. Acetylene differs by 100 * (30 - 8) / 8 = +275%. Both rows request a check. The diagnostic comparison uses the same seven available gases on both sides; it cannot recover unmeasured information.
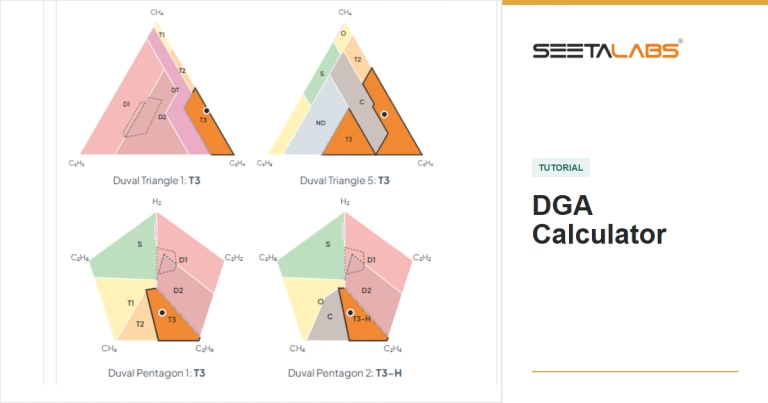
Duval Triangle 1 returns T3 for the laboratory and D2 for the monitor. The IEC ratio result changes from no matching code (laboratory) to D1 (monitor), while the IEEE status remains 3 on both sides. Those are calculation results, not confirmation of two physical faults. An unchanged overall status does not make the disagreement harmless, and a changed zone does not prove the monitor is wrong. Reconcile the measurements and their provenance before choosing an engineering response.
What the reference standard changes
Appendix F uses duplicate transformer-oil samples and a GIOS analysed by the same laboratory equipment over a controlled interval. The procedure corrects each sample result for the laboratory's deviation measured on the GIOS. The brochure's one-gas example is useful for checking the arithmetic; it is not a certificate for the user's monitor. CIGRE TB 783, Appendix F, pp. 45-47.
For that numerical example, take a prepared standard of 93 ppm at 0 C, laboratory standard readings of 91 and 89 ppm at 20 C, four sample readings of 259, 230, 210 and 240 ppm at 20 C, and a monitor reading of 305 ppm at 25 C. Enter these numbers for methane in the worked example.
Keeping full precision through the software calculation gives:
- Common-base standard
S = 99.8094 ppm; mean laboratory standard readingLs = 90 ppm. - Correct each sample with
Lic = Li * S / Ls; their meanA = 260.3363 ppm. - Mean absolute relative deviation of the four corrected samples
R = 6.2833%. - Common-base monitor reading
M = 299.8851 ppm; difference from AD = 15.1914%. - Implemented metric
AC = max(0, abs(D) - abs(R) - 2) = 6.9082%.
The brochure rounds intermediate values and obtains about 7%. The unrounded result agrees at that precision. AC is the procedure's metric after the specified deductions, not a claim that the monitor is 93.1% accurate, a confidence interval, or a prediction of performance at every concentration. The fixed two-percentage-point deduction must not substitute for checking the actual standard's suitability and documentation.
Keep the conclusion narrower than the evidence
This example concerns a mineral-oil main tank, not an OLTC compartment. Preserve the source reports, qualifications, sample timing and common-base calculations. A quick comparison does not replace the GIOS procedure or justify a calibration adjustment. Nor does a successful reference check resolve every problem with sample representativeness or future drift.
Investigate your paired readings in Online DGA Monitor vs Lab Check.