Can a Duval zone change because of laboratory uncertainty?
Yes. A Duval zone classifies the gas pattern entered, not the fault itself, and a point near a boundary can change zone when one gas moves by a few ppm. Before reading that change as a new fault mechanism, check whether it can come from the uncertainty the laboratory reports and from the assumptions used in the calculation. A sensitivity grid answers the second question; it cannot supply the first.
A Duval zone is a classification of the gas pattern entered, not a measurement of the fault itself. A point close to a boundary may change zone when one gas changes by only a few ppm. Before interpreting that change as a new fault mechanism, check whether it can arise from the measurement information and assumptions used in the calculation.
There are two separate questions: what uncertainty does the laboratory report for this sample, and how sensitive is the calculated zone to changes in its inputs? A sensitivity grid can help answer the second. It cannot supply the missing answer to the first.
On this page (6 sections)
Start with the Laboratory Result
Keep the original report, gas units, reporting limits and qualifiers. Ask whether the stated uncertainty is standard or expanded, which coverage factor applies, and what the estimate includes. Sampling and analysis are not interchangeable sources of uncertainty. The Eurachem/CITAC uncertainty guide explains these distinctions, how a reported uncertainty should be expressed, and when correlation between inputs must be taken into account.
The examples here concern a mineral-oil main tank. Do not transfer them unchanged to ester fluid or an OLTC compartment. The public scope of IEC 60599:2022 describes mineral-oil equipment with cellulosic insulation and stresses engineering judgement when acting on the indications.
What the Calculator Actually Tests
Seetalabs® DGA Calculator version 1.0.8 (October 2026) uses relative perturbations of 15 percent above 10 ppm, 30 percent from 5 through 10 ppm, and 75 percent below 5 ppm. These are fixed sensitivity assumptions in the software, not a gas-specific uncertainty budget supplied by your laboratory. At exactly 10 ppm the tool uses 30 percent.
IEC 60599:2022 clause 6.2 discusses uncertainty in gas ratios, with concentration levels expressed as multiples of the analytical detection limit S, rather than uncertainty in zones. CIGRE TB 783 section 5.3 adds that inaccuracies of 30 percent are common even above 10 ppm, so the 15 percent band is not a conservative assumption. The tool uses absolute ppm thresholds. Use laboratory-specific evidence to decide whether these bands are informative for your result.
For Triangle 1, nine evenly spaced levels are tested for each of CH4, C2H4 and C2H2: 9 x 9 x 9 = 729 combinations. For Pentagons 1 and 2, and for the Unified Pentagon shown in the same table, five levels for each of the five fault gases produce 5^5 = 3125 combinations per method. The bands are selected from the original concentrations, not reassigned at each perturbed value.
The interface uses the label "same zone at every grid point checked". More precisely, the calculation normalises zone shares over the grid points for which the method returns a classification; points without a zone are excluded from that denominator. A share of 100 percent therefore means that all classified points returned the nominal zone, not necessarily that every attempted point was classified. All grid points are classified in the two Triangle 1 examples below.
Even with complete grid coverage, this is not a proof covering every point between grid levels, and the bands are fixed values, not the uncertainty stated by your laboratory. Zone shares are not probabilities of a fault. The calculation does not fit a joint probability distribution or model laboratory correlations.
A Stable Pattern, Step by Step
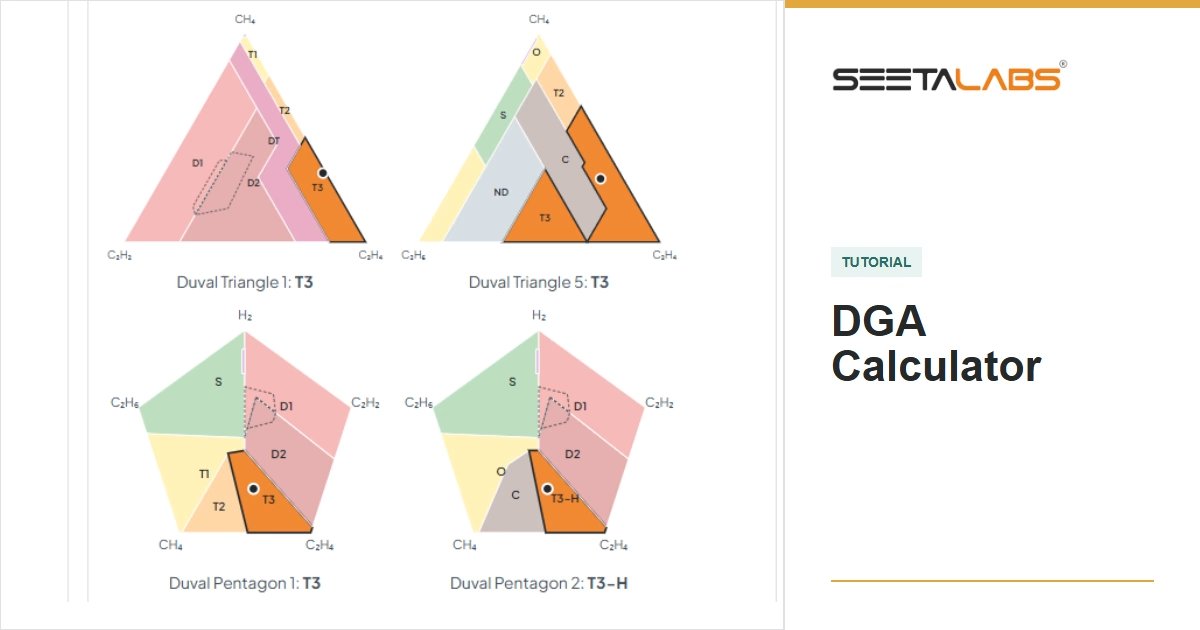
Use the calculator's synthetic example "Mineral oil: hot spot above 700 °C" (Triangle 1 zone T3): mineral oil, main tank, age 22 years, one sample. The five fault gases are H2 150, CH4 260, C2H6 80, C2H4 520 and C2H2 9 ppm. The remaining preset values are CO 250, CO2 2500, O2 2200 and N2 53000 ppm. These are demonstration inputs, not a customer case.
Triangle 1 uses only three of those gases. Their sum is 260 + 520 + 9 = 789 ppm. Dividing each by 789 and multiplying by 100 gives:
- CH4: 32.9531 percent.
- C2H4: 65.9062 percent.
- C2H2: 1.1407 percent.
Do not divide by the sum of all nine gases. H2 and C2H6 enter the pentagon calculation, but not the Triangle 1 coordinates.
With the software's assumed bands, CH4 ranges from 221 to 299 ppm, C2H4 from 442 to 598 ppm, and C2H2 from 6.3 to 11.7 ppm. The calculation returns T3 for all 729 Triangle 1 combinations. Pentagon 2 returns T3-H at the nominal point and throughout its own grid.
That establishes repeatability of these classifications under the tested perturbations. It does not measure a hot-spot temperature, demonstrate that paper is unaffected, or prove the equipment is safe. One sample also cannot establish the rate at which gas is being generated.
A Boundary Case Gives a Different Answer
Now enter a synthetic boundary case by hand (it is not one of the built-in examples): H2 50, CH4 80, C2H6 30, C2H4 20 and C2H2 0 ppm. Triangle 1 normalises this to 80 percent CH4, 20 percent C2H4 and zero C2H2. The tool's boundary convention assigns the nominal point to T2.
The grid gives 405 T2 evaluations and 324 T1 evaluations, about 55.6 and 44.4 percent. The interface rounds these shares to 56 percent T2 and 44 percent T1. They do not mean a 55.6 percent chance of a T2 fault. Here the nine acetylene levels all equal zero, so the 729 evaluations include repeated coordinates. This is an illustrative calculation, not a justification for replacing a laboratory non-detect with zero.
A useful review note would be: "Nominal Triangle 1 zone T2; T1 also appears under the stated perturbation model." Retain both outcomes and investigate the evidence before interpreting a boundary crossing as a physical change.
Low Values Need Their Original Qualifiers
The built-in example "Mineral oil: low-energy discharges (D1)", H2 160, CH4 20, C2H6 4, C2H4 14 and C2H2 60 ppm, gives Triangle 1 zone D1. The 4 ppm ethane value can matter to a pentagon calculation, but cannot directly move a Triangle 1 point: ethane is not one of its coordinates. A small quantified value is not automatically a censored result.
For a report marked "<0.5", preserve that qualifier and ask what limit it denotes. The calculator's endpoint check evaluates zero and the stated bound and withholds affected method results when they differ. This is a Seetalabs® screening rule, not a claim that IEEE prescribes this algorithm. Endpoint agreement is not a proof of stability throughout the interval or a confidence statement about the true concentration. For a censored gas the uncertainty grid starts from zero, so all of its grid levels equal zero: the grid does not explore the interval between zero and the reported limit. Only the endpoint check addresses that interval, and only at its two ends.
With C2H2 entered as "<0.5" and C2H4 as 2.0 ppm, the endpoint ratio range is 0 to 0.25, treating the denominator as fixed. If its uncertainty also matters, that range is incomplete. "ND" without a numerical limit cannot supply a quantitative upper bound. Near-zero reporting warrants particular care, as discussed in Appendix F of the Eurachem guide.
Record the Decision, Not Only the Zone
Keep the method and software version, original sample, qualifiers, assumed bands, nominal classification and alternatives together. Check sample identity, collection and handling history, earlier comparable results and operating conditions. A repeat analysis and a new sample address different possible problems; choose the follow-up with the laboratory and responsible engineer.
Agreement between methods using the same gas measurements is not independent confirmation of a fault. Likewise, a stable label is not permission to defer an investigation prompted by other evidence. The result supports engineering review; it does not replace it.
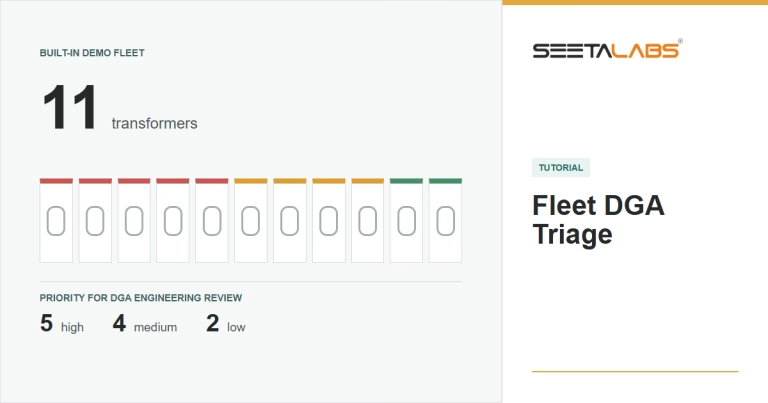
Check your own sample in the DGA Calculator: it runs the same uncertainty grid in your browser. For several transformers in one laboratory file, use Fleet DGA Triage.