What does the Duval Triangle actually tell you?
Duval Triangle 1 turns methane, ethylene and acetylene into a point inside fault-identification zones. Its geometry returns a zone for any valid measurement, even when the evidence for a fault is weak, so data quality, concentrations, trends and applicability come first. The zone is a hypothesis to investigate, not a diagnosis or an operating instruction on its own.
On this page (8 sections)
- What is the Duval Triangle and what does it actually tell you?
- How to read it
- The seven zones and what each means for the asset
- The trap: it always gives you an answer
- Triangle 4 and Triangle 5, and when they apply
- Esters change the picture
- Where Duval sits next to the ratio methods
- Putting the evidence and methods in order
What is the Duval Triangle and what does it actually tell you?
The Duval Triangle is a graphical fault identification method for dissolved gas analysis. Take three hydrocarbon gases from an oil sample, express each as a percentage of their sum, and plot the result inside an equilateral triangle whose interior is divided into named fault zones. The zone containing the point gives the suggested fault type. That is the whole mechanism.
What makes it worth using is not the geometry, which is trivial, but where the zone boundaries came from. Michel Duval drew them by plotting transformers whose faults had been confirmed by physical inspection after the unit was opened, then tracing the lines that separated the clusters. The zones summarise what inspected machines looked like in gas space. They are not derived from a chemical model of oil decomposition, and nobody has claimed they were.
This matters when you decide how much weight to give the output. A zone assignment tells you which population of previously inspected faults your sample most resembles. It does not tell you that your transformer has that fault. IEEE C57.104-2019, clause 6.2.3, draws the line in one sentence: “The fact that a possible fault type is identified is not in itself a confirmation of the presence of a fault.” Everything sensible about using the triangle follows from taking that sentence literally.
Successive samples can show how the gas pattern evolves. A stationary point with rising concentrations indicates increasing gases in similar proportions; it does not by itself establish that a particular fault is worsening. Movement between zones can reflect a change in gas sources, a mixture of mechanisms, oil treatment or analytical variation. Interpret the track with the unit’s history.
How to read it
Triangle 1 uses methane, ethylene and acetylene. Sum the three concentrations in ppm, divide each by the total, and you have three percentages adding to 100. Those are barycentric coordinates: they define exactly one point, and every point corresponds to exactly one such triple. Each side carries the scale for one gas, and the graduations run in a rotational direction that people get wrong constantly when plotting by hand.
Normalisation removes magnitude: 2 ppm methane, 1 ppm ethylene and 0.3 ppm acetylene produce the same point as 2000, 1000 and 300 ppm. The lower-concentration sample needs particular attention to detection limits and uncertainty; it cannot automatically be dismissed as rounding. The higher concentrations call for assessment, but neither point alone establishes condition or the required action.
Begin with the analytical quality and a reference appropriate to the fluid and equipment, then review concentrations and trends before interpreting coordinates. The guides include cautious expert exceptions for some low-level cases with adequate analytical accuracy. Our guide to normal dissolved gas levels in transformers explains the mineral-oil screening context and why population-based norms are different from universal fault thresholds.
Why three gases and not seven
Routine DGA commonly reports several hydrocarbons, carbon oxides and atmospheric gases. Triangle 1 uses three gases with different formation patterns; its diagnostic boundaries are empirical, even though the choice also has a physical basis.
Methane, ethylene and acetylene are associated with different thermal and electrical decomposition regimes. Methane is prominent in lower-temperature patterns, ethylene in hotter thermal patterns and acetylene in high-energy discharge patterns. Their proportions support fault-type identification. They do not form a universal severity scale: the severity of a defect also depends on activity, location, affected materials and operating context.
Triangle 1 omits hydrogen and ethane, which can add information about partial discharge, stray gassing and thermal processes. Carbon oxides and cellulose markers provide additional evidence when paper involvement is suspected, but are not unique indicators by themselves. The additional triangles and pentagons broaden the gas-pattern assessment; complementary tests and history remain necessary.
The seven zones and what each means for the asset
Triangle 1 partitions its interior into seven named regions: six basic fault types and the mixed DT zone. This article explains the method without reproducing its full numerical boundary dataset. Implementations should identify the licensed primary source and verify the boundary rules, including shared edges and vertices.
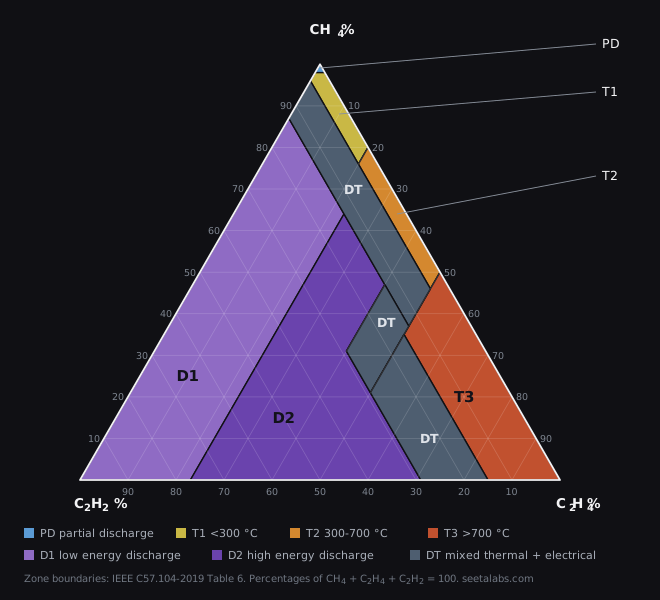
PD denotes a pattern associated with partial discharges of the corona type and lies near the methane vertex in Triangle 1. Because hydrogen is omitted from this triangle, review it and the rest of the evidence. A PD-zone result does not itself determine urgency; location, activity, trend and other diagnostics can make a discharge significant.
T1, T2 and T3 describe thermal fault classes associated with temperature ranges below 300 °C, 300–700 °C and above 700 °C. These are characteristic fault categories, not a thermometer reading from the oil sample. The physical observations listed in the guide describe inspected fault examples; a zone assignment does not prove that paper has carbonised or that metal has melted.
D1 and D2 denote lower- and higher-energy discharge patterns. Inspected examples can include damaged paper, carbonisation or metal damage, but a gas zone is not proof that those findings exist in a particular unit. Active discharge evidence can warrant urgent engineering review; removing a transformer from service requires consideration of the full evidence, protection behaviour and system consequences.
DT is the seventh zone and it is the honest one. It sits between the thermal band and the discharge region and means the gas pattern is consistent with a mixture of electrical and thermal faults, or with a fault the method cannot resolve into one class. CIGRE Technical Brochure 771 shows that a real mixture of a T3 and a D1 can land anywhere along a path between the two pure zones depending on the relative contribution of each, and that some of those mixtures land squarely inside D2. A DT assignment is the method reporting ambiguity, and it should be read as an instruction to bring in the pentagons, the carbon oxides and the operating history.
The trap: it always gives you an answer
For a positive sum of valid non-negative inputs, the three percentages add to 100 and define a point in Triangle 1. Its zone map covers that domain. If all three inputs are zero, the percentages are undefined; negative values or unresolved non-detects also require explicit handling. A correct implementation must reject invalid inputs and apply its evidence checks before reporting a zone.
C57.104-2019 states the property as an advantage and immediately qualifies it. The triangle “always proposes a fault identification (it is a ‘closed’ system as compared to 2-gas ratios methods)”, and then: “because it always gives a diagnostic, it should be used only to identify a fault when other information indicates that a fault is likely to exist.” Read those two clauses together. The closure that makes the method attractive is what makes it dangerous without a gate in front of it.
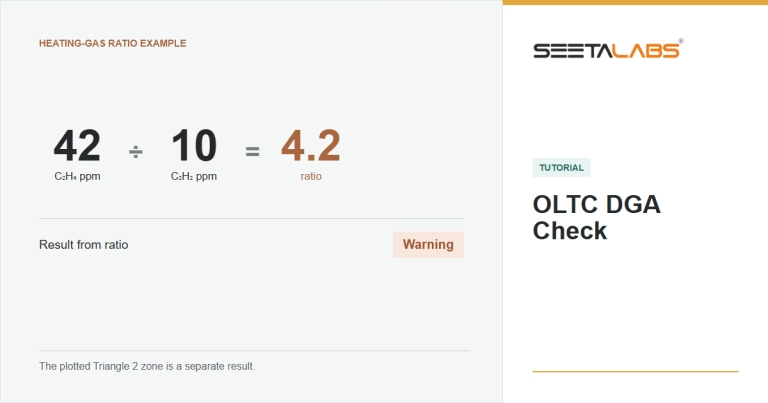
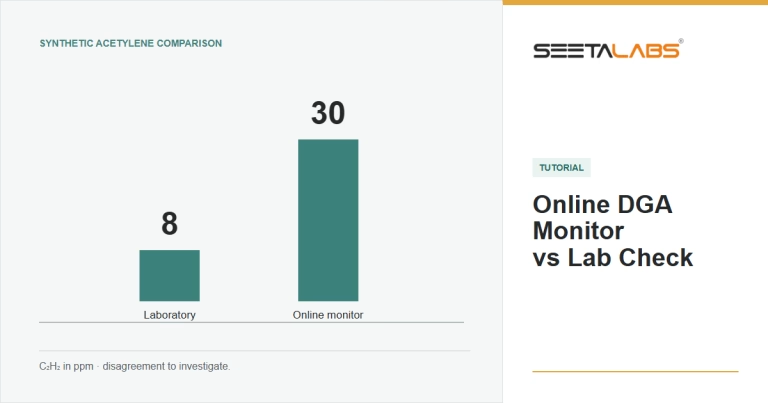
A pipeline that computes coordinates and prints a fault name for every input can create a misleading result. For example, a small acetylene reading near the laboratory detection limit can become a large percentage if the other gases are also small. The named zone must be accompanied by the concentration evidence and analytical limitations before it is used in a condition decision.
When the coordinates are noise
There is no single ppm value below which every ratio is automatically meaningless. Reliability depends on the gas, analytical method and uncertainty. Two values each bounded by ±30% can produce a ratio from about 0.54 to 1.86 times the central ratio, if the extreme errors are allowed in opposite directions; that is not a symmetric ±60% interval. Near a zone boundary, assess how plausible measurement variation affects the interpretation.
IEEE C57.104-2019 Section 5.2.1 cautions against fault identification below about five times the method detection limit without confirmation of accuracy. It generally advises against fault identification when all gases are below Table 1, but permits cautious expert interpretation under additional rules where analytical accuracy is demonstrated. IEC 60599:2022 Section 6.1(c) also recognises increasing or abnormal values below typical levels. These are conditional recommendations, not a universal concentration-only gate.
An engine needs to report when the evidence is insufficient and explain why. A benchmark should state how such abstentions are handled: overall accuracy, accuracy on classified cases and coverage measure different things. Abstaining does not necessarily lower every metric, and guessing is not a substitute for reliable evidence. Our overview of dissolved gas analysis of power transformers discusses how to interpret performance claims.
Triangle 4 and Triangle 5, and when they apply
Triangle 1 resolves six fault classes. Duval defined two further triangles to split those classes into sub-types, using different gas triples and different zone layouts.
Triangle 4 uses hydrogen, methane and ethane to refine suitable low-temperature patterns. Its zones help distinguish partial-discharge, stray-gassing and overheating patterns, including possible paper involvement. Some oils can generate stray gases at relatively modest temperatures without a damaging fault; confirm the source and operating context before treating that explanation as established.
Triangle 5 uses methane, ethylene and ethane to refine suitable thermal patterns. It can help distinguish hotter oil-only patterns from patterns consistent with paper involvement. IEEE C57.104-2019 warns that a paper-carbonisation zone indicates a possibility, not certainty, and calls for further investigation using carbon oxides and furans. The triangle alone does not identify the physical location or mechanism.
Why gating matters
Triangles 4 and 5 are refinements, not independent classifiers, and the standard is unusually direct about their preconditions. C57.104-2019 lists three rules for their use, and they are worth enforcing as a hard gate rather than treating as advice:
- Neither triangle should ever be used for a case that Triangle 1 identified as an electrical fault, D1 or D2.
- Triangle 4 applies only to a case first identified as PD, T1 or T2.
- Triangle 5 applies only to a case first identified as T2 or T3.
The additional triangles have defined application domains and include regions labelled ND, meaning not determined. They are not independent classifiers that necessarily return a thermal subtype for any input. Evaluate Triangle 1 first, then use Triangle 4 or 5 only within the stated domain and report ND where the applicable zone requires it. Preserve this distinction between an out-of-domain calculation and an inconclusive result within the method.
Esters change the picture
Natural and synthetic esters have different gas-generation and solubility behaviour from mineral oil. IEEE C57.155-2014 discusses these differences and remains a useful historical technical source. IEEE lists it as inactive-reserved from 27 March 2025; it should not be represented as an active current standard. Check the current applicable source and the actual liquid family before choosing a method.
IEEE C57.155-2014 describes methane, ethane and ethylene generation under thermal stress in esters, including differences from mineral oil and non-fault ethane formation in some natural esters. Applying mineral-oil boundaries can therefore misclassify an ester sample. The direction and size of the error depend on the liquid, mechanism and gas pattern; it does not overestimate the thermal class in every case.
Published Duval methods for non-mineral liquids use liquid-specific boundaries. A software implementation should identify the source and version for the declared fluid and verify any refinement or gating rules from that source. Do not assume that a method calibrated for one natural ester applies unchanged to another formulation or to a synthetic ester.
Where the published zones stop
Three checks are particularly useful when assessing the declared coverage of a diagnostic tool:
Pentagon 3 methods for non-mineral liquids appear graphically in TB 771 Appendix H.8, which directs the reader to reference B40 for numerical boundaries. A figure alone is not sufficient to validate an exact implementation, but its graphical presentation does not prove that numerical sources do not exist. Confirm the actual source and check any digitisation uncertainty rather than asserting a universal publication gap.
For Triangles 6 and 7, identify the liquid and experimental or service population supporting the specific published zone set. Verify applicability before transferring a formulation-specific method across FR3, other natural esters or synthetic esters. Report the scope supported by the source and the implementation validation.
Silicone has a published interpretation framework: IEEE C57.146-2025 includes guidance on gases, trends and a silicone Duval method. It applies to transformers originally manufactured with silicone liquid and excludes retro-filled transformers. A product must separately establish whether it implements that framework; mineral-oil criteria cannot simply be relabelled for silicone.
Where Duval sits next to the ratio methods
The IEC 60599:2022 ratio scheme takes a different approach to the same problem. It computes ratios between gas pairs, checks them against defined ranges, and returns a fault class only when a combination matches one of the listed cases. When a combination falls outside every range, the table returns nothing. The standard says that such a case “can be considered a mixture of faults, or new faults that combine with a high background gas level”, and directs the reader to the graphical representations in Annex B to see which characteristic fault is nearest.
TB 771 discusses cases that fall outside two-gas ratio codes and reports method-comparison results from cited studies. Those figures describe the evaluated methods and datasets, not universal error rates for every application. An unclassified ratio combination and an incorrect diagnosis are different outcomes and should be counted separately in any assessment.
TB 771 explains its use of triangles and pentagons in its database work. That choice does not establish one general accuracy percentage for a new software implementation or fleet. A defensible performance claim identifies the reference diagnoses, equipment population, evaluation split, uncertainty and treatment of unclassified or inconclusive cases.
Compare methods where their domains overlap and examine disagreements. Agreement can add context, but these methods reuse much of the same gas information and are not independent confirmations of a fault. Disagreement may reflect boundaries, mixtures, background gases or data quality. It should prompt review rather than an automatic majority vote.
Putting the evidence and methods in order
A sound Triangle 1 implementation verifies its zone coverage and boundary conventions for valid inputs and handles invalid data explicitly. Triangles 4 and 5 follow only within their defined mineral-oil domains, including ND outputs. Ester and silicone methods require their own applicable sources. Parallel ratio or pentagon results can provide context, with inconclusive outputs retained rather than hidden.
Before interpreting a zone, review the sample and analysis, concentrations, trends, equipment and liquid. IEEE C57.104-2019 provides the relevant mineral-oil statistical screening framework; its acetylene-change entries require attention but do not turn analytical noise into a confirmed fault. Where cautious expert interpretation is justified below typical levels, document the basis and uncertainty instead of presenting it as a routine unconditional diagnosis.
This chain produces decision support for qualified personnel who know the unit, its loading and maintenance history. The triangle helps organise fault hypotheses and track the gas pattern; the operating decision combines that information with other evidence. The RONIN platform page describes the project and the role of traceable interpretation in that workflow.
Technical references: IEEE C57.104-2019, Sections 5.2.1, 6.1 and 6.2.3 and Annex D.4 (including the ND zones and gating rules); IEC 60599:2022, Sections 6.1–6.2; CIGRE TB 771, Sections 2.1–2.2 and Appendix H.8; IEEE C57.155-2014, Sections 4–5 and Annex G. For silicone, IEEE C57.146-2025, Sections 1.1 and 6.2.5. Source scope and publication status checked on 1 October 2026.