Is there a normal dissolved gas level for a transformer?
No single level is normal for every transformer. IEEE C57.104-2019 compares mineral-oil results with statistical norms conditioned on age and the O2/N2 ratio, with separate criteria for change and rate of change. A result outside a norm calls for an assessment, not an automatic diagnosis, and increasing acetylene always deserves attention.
On this page (8 sections)
- What is a normal dissolved gas level in a transformer?
- Why universal fixed limits can mislead
- Why the trajectory matters alongside the level
- Why low concentrations need special care
- What a system should do when it cannot tell
- Why raw accuracy is the wrong way to judge a diagnostic system
- What the published method chain covers, and where it stops
- How to use this on your own fleet
What is a normal dissolved gas level in a transformer?
A normal level is a comparison with an appropriate reference population and the unit’s own history. For mineral-oil transformers, IEEE C57.104-2019 provides statistical norms rather than a single set of universal fault limits. Equipment design, fluid, operating conditions, age, oxygen exposure and trend all help determine what a result means.
Older editions of IEEE C57.104 used condition tables that are still widely reproduced. The 2019 edition introduced a different DGA-status approach based on statistical concentrations, changes and rates. A threshold can still be useful when its source and application are appropriate; the problem is treating a screening value as a universal boundary between healthy and faulty transformers.
So if you are looking for a normal level, the question you actually need answered is narrower and more useful: normal for what kind of transformer, at what age, with what oxygen exposure, and moving how fast. Ask it that way and it becomes answerable.
A maintenance engineer may need to screen many laboratory reports quickly. A fixed column of limits is simple, but its meaning depends on its provenance. Check whether it comes from a current guide, a validated utility practice or a manufacturer’s equipment-specific recommendation. It cannot be described as the IEEE 2019 method if that method’s conditioning variables and trend rules have been omitted.
Why universal fixed limits can mislead
A two-year-old unit and an older unit can have different gas histories, preservation systems and operating duties. A single concentration limit loses some of that context. The 2019 statistical analysis provides population-based screening criteria, while the guide also recognises that users may need criteria appropriate to their own equipment and experience.
What IEEE C57.104-2019 changed
The 2019 edition rebuilt the screening criteria from a large statistical study of laboratory DGA results. Clause 6.1.3 sets out the norms in four tables. The first gives 90th percentile gas concentrations as a function of the O2/N2 ratio and transformer age. The second gives the 95th percentile of the same. The third and fourth are not about level at all: they give 95th percentile values for how much a gas moved between two consecutive samples, and for the rate fitted across a series of three to six samples.
The method assigns one of three DGA statuses using the concentration and trend evidence. These describe the DGA results, not a complete transformer condition assessment. IEEE C57.104-2019 Section 6.1 explicitly warns against equating status with condition: a unit may operate with high residual gases, and some failure mechanisms generate little or no detectable gas.
A 90th-percentile value describes the distribution from which it was derived; it does not require ten per cent of every fleet to be flagged. A particular fleet can differ in size, design, operation and sampling. Multiple gases are also evaluated together. An unusually high or low flag rate is a reason to review applicability and data quality, not proof that the thresholds are wrong.
Age and O2/N2: why the same number means two different things
Tables 1 and 2 use age bands of 1–9 years, 10–30 years and over 30 years, together with an unknown-age category. The dissolved O2/N2 ratio is split at 0.2 and helps characterise oxygen exposure. It is a measured proxy: preservation design, oxygen consumption and service history can affect the value. Record the actual ratio and relevant equipment history instead of assigning a group from the nameplate alone.
The differences between reference populations are gas-specific and also depend on the chosen percentile and age band. They do not all move in the same direction. In particular, the acetylene norms in the low-O2/N2 group are not ten times those in the high-O2/N2 group; Tables 1 and 2 show the opposite ordering for those groups. Select the actual table entry instead of applying a generic sealed-to-breathing multiplier.
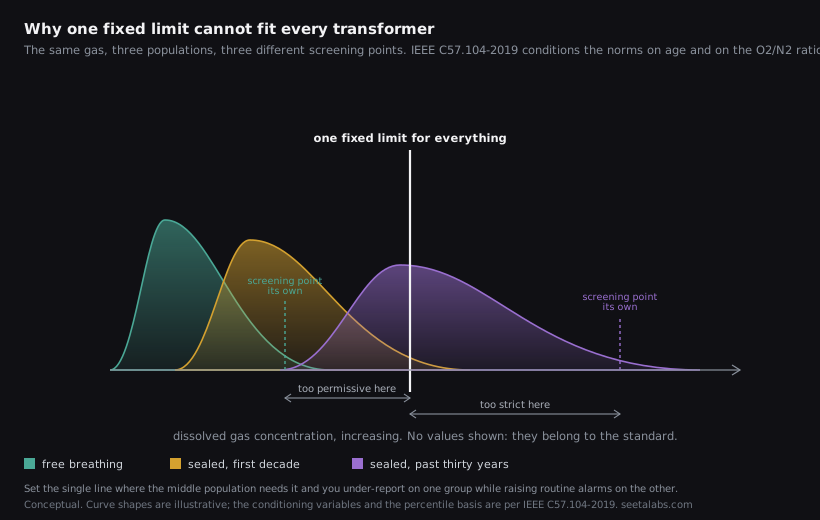
There is a second-order trap worth naming. Because oxygen and nitrogen are themselves measured quantities, a unit near the 0.2 boundary can flip categories between samples, and its screening criteria flip with it. The guide notes this. Knowing it happens is the difference between investigating an apparent step change and shrugging at it.
Why the trajectory matters alongside the level
The 2019 guide includes both concentration and trend criteria. Omitting the latter can miss evidence of recent gas generation, even when the absolute level is modest. Their interpretation still needs measurement quality, sampling history and any event that could add or remove gas.
A concentration reflects accumulated gas as well as removal, dilution and exchange processes. A rate helps identify recent change, but a doubling from a very small baseline is not automatically evidence of a fault. Check the absolute change and uncertainty. Table 4 was derived for series with gas levels below Table 1 norms, specifically supporting review of changes that level screening alone could miss.
The two trend tables serve different purposes. Table 3 addresses an absolute difference between consecutive results; it is not a rate per unit time. Table 4 addresses a fitted rate over a series of three to six valid points, with period bands of 4–9 and 10–24 months. Use the table’s conditions and check that oil treatment, maintenance or sampling differences do not invalidate the comparison.
The acetylene exception
The acetylene entries in the trend tables are qualitative: Table 3 says “any increase” and Table 4 “any increasing rate”. Table 3 concerns a change in concentration between samples, while Table 4 concerns a rate over time. In both cases, confirm that the apparent movement is meaningful relative to measurement uncertainty and the unit’s history.
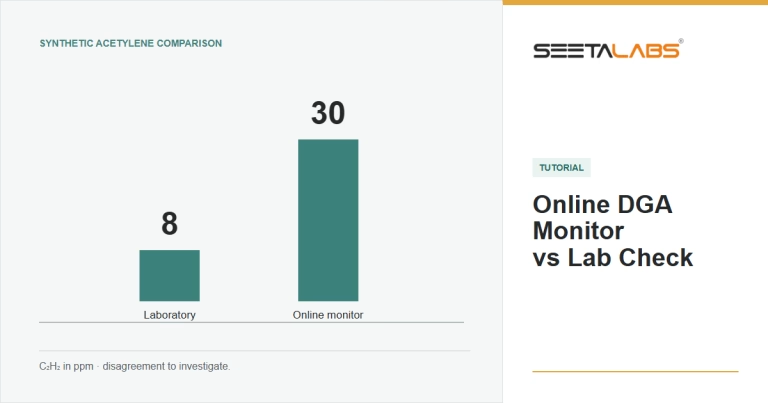
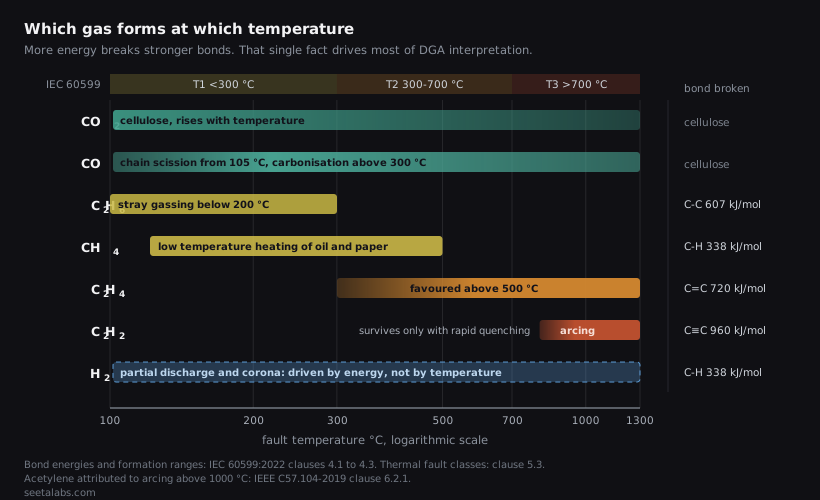
Acetylene is associated with high-energy decomposition and often with discharges, which explains the attention given to increasing concentrations. However, an increase does not prove an active main-tank discharge: residual gas, communication with an OLTC compartment, contamination and analytical effects can also matter. Confirm a small increase and review the possible sources before assigning a fault or an operating action.
The guide calls for particular caution when acetylene alone exceeds Table 1 while remaining below about five times the method detection limit. It does not establish that this pattern is usually an analytical artefact. Review analytical accuracy and possible contamination, obtain confirmation where needed, and combine the result with trend and operating evidence.
Why low concentrations need special care
Everything above concerns screening: is this unit worth a closer look. Fault identification is a different exercise, and it runs on ratios between gases rather than on the gases themselves. Duval triangles, the IEC ratio scheme, the Rogers approach: all of them take proportions and map them onto fault types. Our guide to dissolved gas analysis of power transformers works through how each of those methods reaches its verdict.
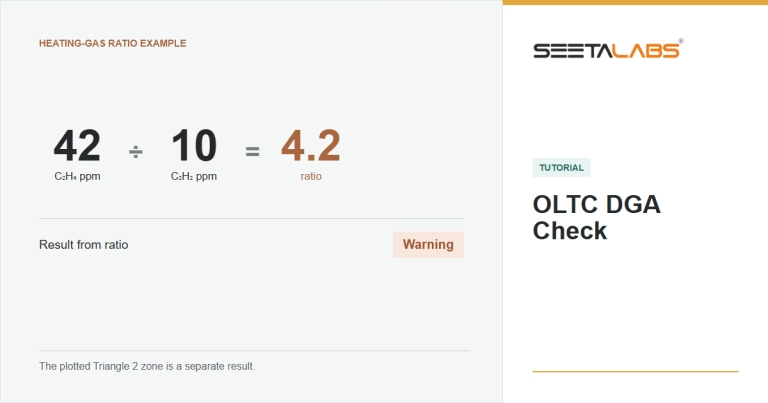
Ratios can become unstable when one or both values are small relative to their uncertainty. IEC 60599:2022 Section 6.2 discusses increasing uncertainty near the analytical detection limit and cautions against over-interpreting the result. The appropriate question is whether plausible measurement variation would change the diagnostic interpretation, rather than whether a single universal ppm floor has been crossed.
IEC 60599:2022 Section 6.1(c) first links meaningful ratios to gas concentration and rate above typical values, but also recommends calculating them for increasing or abnormal concentrations below those values when they are sufficiently accurate. IEEE C57.104-2019 Section 5.2.1 generally advises against fault identification when all gases are below Table 1, while allowing cautious expert interpretation under additional rules and confirmed analytical accuracy. Neither document supports an unconditional rule that every low-level sample must be classified, or that no such sample may ever be interpreted.
A sample with barely measurable hydrocarbons can still yield proportions that land in a named Duval zone. That geometric result does not establish a fault. If the analytical uncertainty is large enough to change the zone, the engineer needs the concentration evidence and its limitations before drawing a conclusion.
What a system should do when it cannot tell
It should say so.
When the evidence does not support reliable fault identification, report the limitation and its reason. A non-detect is not an exact zero; a ratio with an unresolved denominator may be unbounded or uninterpretable. Depending on the method and analytical evidence, an expert may be able to use bounds or cautious interpretation. Software should distinguish that review from a routine, unqualified fault classification.
Abstention is a design decision, not a gap
Abstention has to be designed in rather than left to emerge. The IEC ratio scheme declines by construction when a ratio is not calculable. The secondary Duval triangles need gating so that they only run after the primary one has established that their preconditions hold, because Triangle 4 is defined for cases already identified as partial discharge or low-temperature thermal, and Triangle 5 for cases already in the thermal range. Running them unconditionally would produce zone assignments outside the domain their author defined.
A useful condition report explains which conclusions the data support and which additional evidence would resolve uncertainty. Software can apply that same discipline by showing analytical flags, applicability conditions and reasons for an inconclusive result alongside the measurements.
Why raw accuracy is the wrong way to judge a diagnostic system
A diagnostic evaluation needs to measure both the quality of reported results and the cases in which the evidence remains inconclusive.
The treatment of abstentions depends on the evaluation protocol. If all samples remain in the denominator and an abstention earns no correct prediction, declining cases can lower overall accuracy; it does not necessarily do so, and it does not mean guessing is better in service. Report coverage, performance on classified cases and the reasons for abstention together.
Published accuracy figures depend on the dataset, labels, class balance and validation design. A very high number deserves scrutiny but does not by itself prove leakage or a small sample. Ask how many distinct transformers were tested, whether samples from the same asset crossed the train/test boundary, and whether the evaluation represents future use. A sample-level split can overstate performance when repeated measurements from an asset are correlated.
Better questions to ask of a diagnostic tool are about behaviour rather than score. On what fraction of samples does it decline, and does that fraction correspond to the samples a competent engineer would also call inconclusive. When it is confident, how often is it right. When it is wrong, is it wrong in the safe direction or the other one.
What the published method chain covers, and where it stops
An assessment chain should identify its sources and scope at each step: DGA screening and fault identification for the relevant equipment and liquid; oil-quality interpretation; evidence of cellulose ageing; and a documented aggregation method where an index is used. For mineral oil, IEEE C57.104-2019 and IEC 60599:2022 are central references. CIGRE TB 761 describes alternative Transformer Assessment Indices. The RONIN platform page introduces the project; a method-level record of inputs, rules and supported equipment makes its assessments reviewable.
Coverage should also be documented at the level of each liquid, equipment type and method. The following distinctions help make that scope reviewable:
- Pentagon 3 for non-mineral liquids: TB 771 Appendix H.8 provides graphical methods and points to reference B40 for numerical boundaries. An implementation should identify the actual boundary source, liquid family and version, then verify its coordinates and classification rules against that source. Reading approximate vertices from a figure requires explicit treatment of digitisation uncertainty.
- Ester sub-type methods: Use a zone set only for the liquid family and application supported by its source. Natural and synthetic esters differ, and a method verified for one formulation should not be transferred to another without evidence. Confirm the specific source and applicability before reporting a sub-type.
- Silicone fluids: IEEE C57.146-2025 provides a published DGA interpretation framework, including silicone-specific guidance and a Duval method. Its scope covers transformers originally manufactured with silicone liquid and excludes retro-filled transformers. The remaining question for a software product is whether that framework has actually been implemented and verified for the supported equipment.
- Remaining life in years: A DGA classification or condition score does not directly determine remaining life. A forecasting model needs a defined endpoint, operating assumptions, representative longitudinal outcomes and uncertainty. Evaluate such claims on their evidence rather than treating either universal accuracy or universal impossibility as established.
- Total conformity: not a checkable claim in the first place. Which methods are implemented, and against which published source, is checkable, and it is the better question to ask.
- Expert opinion: not what any such output is. What these methods produce is decision support, to be reviewed by qualified personnel holding engineering responsibility for the asset.
A health index is a constructed assessment, not a direct physical measurement. Its numerical scale is defined by its designer and is not universally fixed at zero to one hundred. Keep the relevant component assessments, missing-data indicators and uncertainty visible, and combine the ranking with consequence and operating context before allocating interventions.
How to use this on your own fleet
If you screen against fixed values, establish their source and purpose. Values copied from an older IEEE edition should not be presented as the 2019 method. A manufacturer’s recommendation or a utility-specific criterion may still be useful for the equipment it covers; check its basis and currency before replacing it.
Check that age, oxygen and nitrogen are retained in the data pipeline. Table 1 and Table 2 include an unknown-age category, but that is not a general fallback for a missing O2/N2 ratio. A missing or unreliable conditioning variable should be made explicit and resolved using a documented engineering approach, rather than silently selecting a broader table entry.
After that, look at whether your process computes rates at all, and over what window. A tool that only compares the latest result against a level threshold is doing half the screening the standard describes. Annual sampling makes the multi-point rate impossible to compute over a short period, which is an argument for sampling more often on the units where it matters.
Finally, check how the tool handles samples close to detection limits. A useful result explains whether the data support routine classification, cautious expert interpretation or further analytical confirmation. That behaviour is as important as the fault name displayed for well-resolved samples.
Primary sources
- IEEE C57.104-2019, Guide for the Interpretation of Gases Generated in Mineral Oil-Immersed Transformers, IEEE Standards Association
- IEC 60599:2022 edition 4.0, Mineral oil-filled electrical equipment in service: guidance on the interpretation of dissolved and free gases analysis, IEC Webstore
- IEC 60422:2013 edition 4.0, Mineral insulating oils in electrical equipment: supervision and maintenance guidance, IEC Webstore. A 2024 edition has since been published; the reasoning here follows the edition held in our library.
- CIGRE Technical Brochure 761, Condition assessment of power transformers, e-cigre.org
Values from these documents are not reproduced here. Clauses are cited so that anyone holding a licensed copy can check the reasoning against the source.
Technical references: IEEE C57.146-2025, Sections 1.1, 5.2.1 and 6, for silicone scope and interpretation; IEEE C57.104-2019, Sections 5.2.1, 6.1 and Tables 1–4; IEC 60599:2022, Sections 6.1–6.2; CIGRE TB 761, Chapters 1–4; TB 771, Appendix H.8. Method-specific thresholds and exceptions must be read in their full context.