Does a running oil pump prove that a transformer cooling circuit has adequate flow?
No. A pump motor can be energised while the oil circuit delivers inadequate cooling, and circulation through the cooler does not prove intended flow through every winding duct. Distinguish measured flow, indicator contacts and pump-curve estimates, and align pressure, cooler temperatures, load and maintenance records. A larger cooler temperature drop can coexist with less flow, so temperature difference alone does not establish cooling duty.
A pump motor can be energised while the intended oil circuit delivers inadequate cooling. Follow the fluid path using flow indication, pressure, cooler temperatures and operating history. Cooler circulation does not prove intended flow through every winding duct.
Reconstruct the Cooling Circuit
Map pumps, cooler banks, valves, indicators and temperature locations on the circuit drawing. Check operating combinations and shared status signals. Replacing an indicator can change the record without changing flow.
The Bureau of Reclamation manual, sections 3.4.5 and 9.4.3, discusses cooling restrictions and pump inspection; its older threshold tables are not used here.
Distinguish measured flow, indicator contact and pump-curve estimate. Record fluid type and temperature for comparisons.
Interpret a Pattern, Not One Alarm
This original table preserves alternatives rather than assigning a fault from one alarm.
| Observation | Possible explanation to test | Discriminating evidence |
|---|---|---|
| Pump command present, no running feedback | Motor, supply, control or feedback problem | Qualified electrical and status verification |
| Running feedback present, low-flow indication | Inadequate flow or faulty indication | Independent circuit-performance check |
| Pressure difference changes | Restriction, changed flow, fluid properties or sensor issue | Measurement locations, temperature and pump condition |
| One cooler remains thermally different | Unequal flow, isolation, air-side conditions or measurement error | Matched cooler configuration and temperature survey |
| Thermal performance changes after work | Changed circuit state or instrumentation | Work records and as-left configuration |
Hitachi Energy's cooling-system documentation lists pressure, flow and thermal changes as maintenance evidence, not unique proof of blockage.
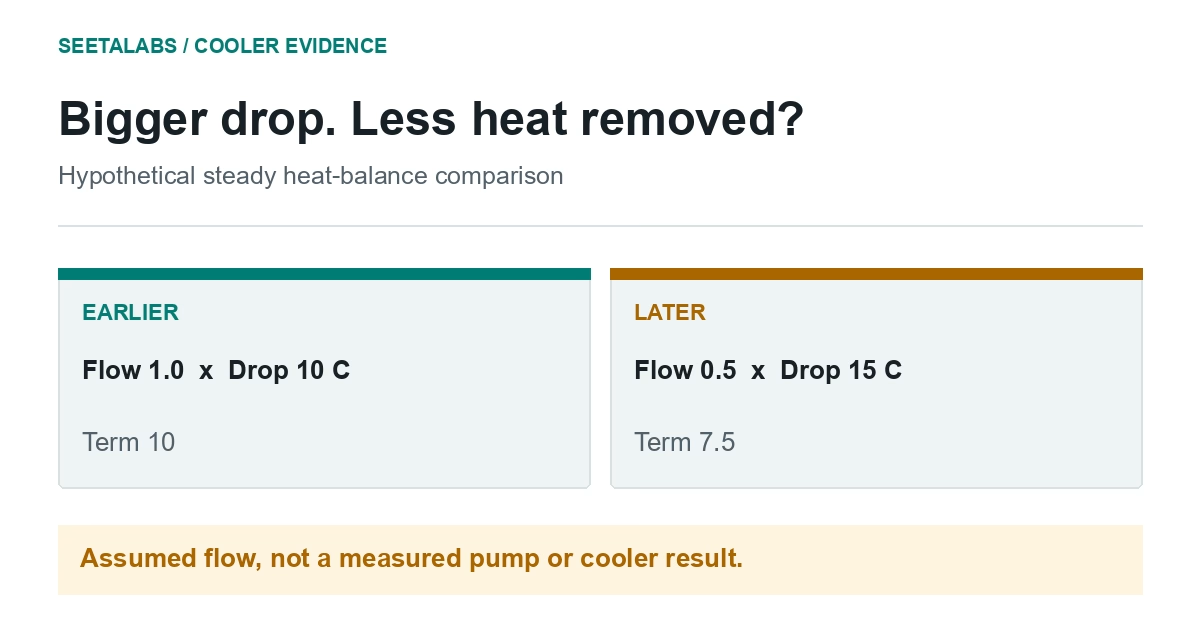
In a simplified steady heat balance, heat transfer depends on mass flow, heat capacity and temperature change. A larger cooler temperature drop can coexist with less flow; temperature difference alone does not establish total cooling duty.
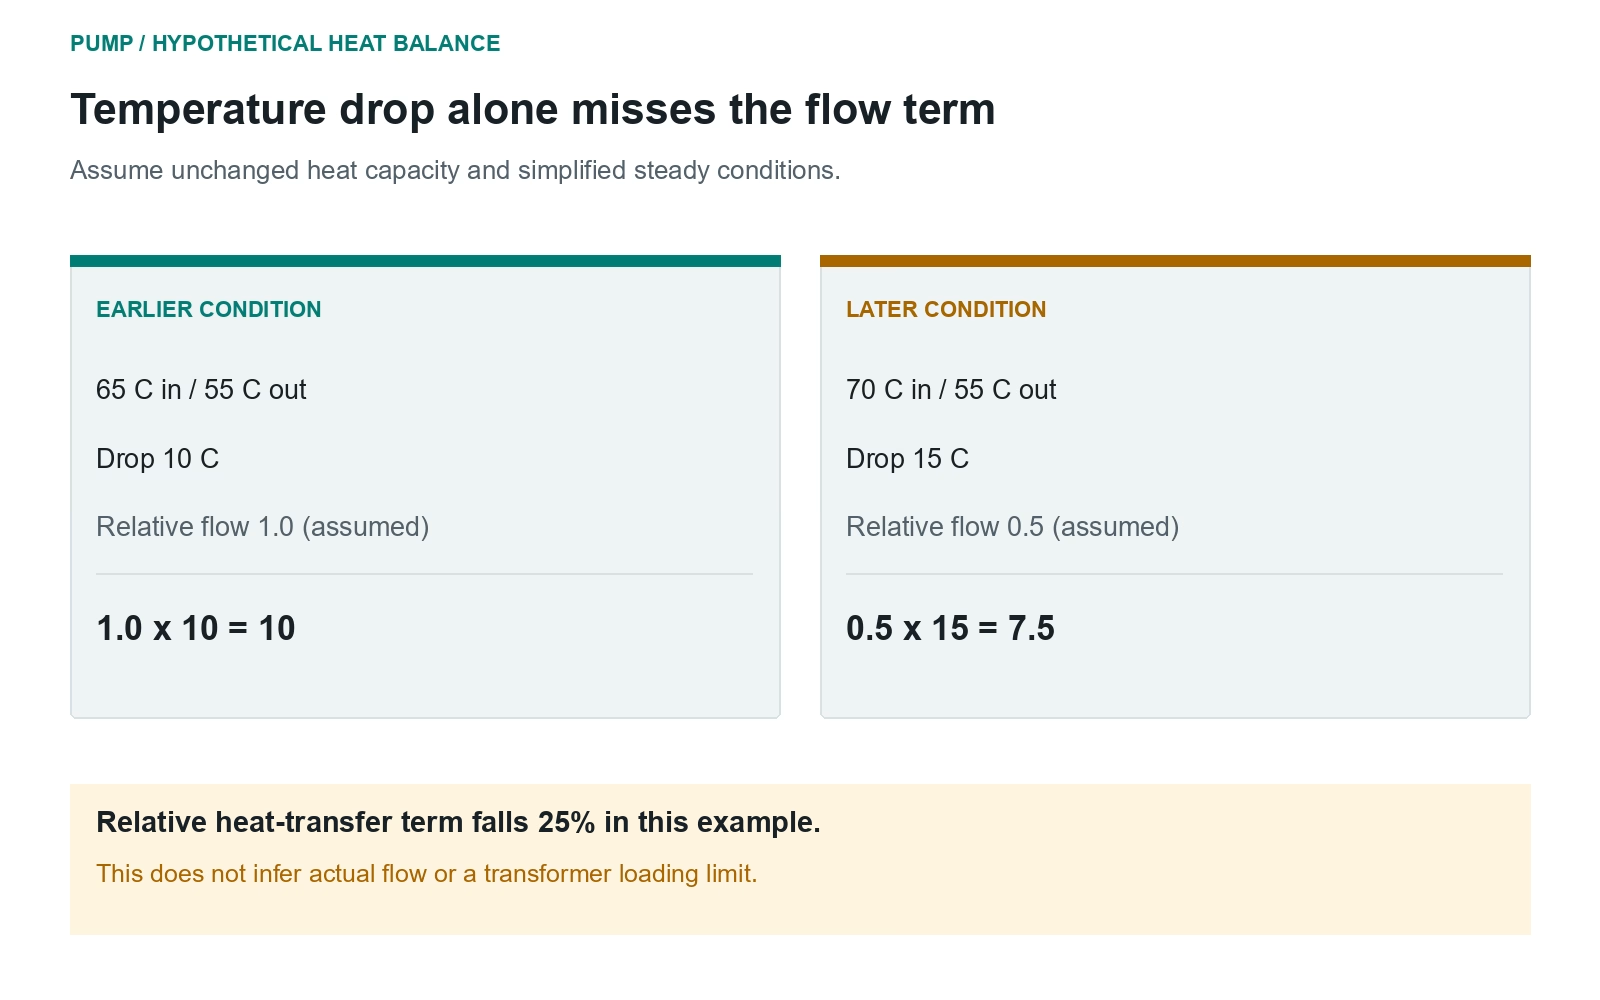
Worked Example: A Bigger Temperature Drop Looks Better
Hypothetical, not a performance claim: cooler inlet/outlet temperatures change from 65/55 to 70/55 degrees C. The drop increases from 10 to 15 degrees, seemingly a 50% improvement.
Assume solely for arithmetic that later mass flow is half the earlier flow and heat capacity is unchanged. Relative heat-transfer terms are 1 x 10 = 10 and 0.5 x 15 = 7.5. Under these assumptions, heat transfer falls despite the larger drop.
That is a 25% reduction, not a measured flow or universal cooler result. A real assessment must consider transient storage, losses, sensor locations and fluid properties.
Align temperature channels, pump configuration, load history, pressure and maintenance records. Check whether conditions were stable enough for the comparison before concluding obstruction.
If evidence cannot distinguish reduced flow from an instrument fault, state the gap and request a qualified check. Do not treat assumed flow as measured.
Preserve the Finding for Thermal Assessment
A thermal model needs an explicit cooling-state assumption. IEC 60076-7:2018 does not establish that normal-cooling parameters remain valid for an impaired circuit.
Keep a time-aligned evidence sheet with circuit, sensor locations and alternatives. After work, preserve the as-left configuration and verification basis. This screening framework supplies no loading instruction.
Link the event to the condition-monitoring record and DGA history. Neither proves adequate internal circulation.
Sources and scope: Bureau of Reclamation (2005), sections 3.4.5 and 9.4.3, checked in the earlier review but not newly accessible; Hitachi Energy cooling documentation and IEC 60076-7:2018 official scope read 29 September 2026. IEC clause 8.2 was checked in the earlier licensed review. The hypothetical heat balance is not a standard model or operating limit.