How does uncertain paper moisture affect a transformer’s short-term overload capability?
It can change which limit governs. Wetter cellulose lowers the bubble-inception temperature, so a four-hour overload governed by hot-spot temperature under one moisture assumption can become bubble-limited under a wetter one. Report the moisture source, range, pressure and gas assumptions with the result, and treat it as a sensitivity assessment, not permission to overload.
A four-hour overload calculation can be governed by hot-spot temperature under one moisture assumption and by bubble formation under another. The transformer, ambient temperature and proposed duty have not changed. The uncertain input is the water content of the paper.
That uncertainty belongs in the result. CIGRE TB 741 (2018) notes that wetter cellulose and a lower degree of polymerisation reduce the temperature at which bubbles start to form. Further reading: CIGRE's discussion of solid insulation condition. A precise-looking load multiplier does not remove uncertainty in the underlying measurements and assumptions.
Separate three questions
First, what evidence supports the paper-moisture estimate? An oil result reports water in the sampled liquid at a stated temperature, not a direct measurement of water throughout the winding insulation. The model can use a paper-moisture result supplied from dielectric-response analysis, or estimate it through oil-paper equilibrium curves. Neither route should lose its test conditions and interpretation limits.
Second, what bubble-inception temperature follows from that moisture assumption, local pressure and gas content? Those are separate inputs. Paper moisture and pressure alone do not fully specify the calculation.
Third, what load produces the limiting temperatures over the stated duty? The model starts at thermal steady state under a specified preload, then applies a step in load for the selected duration at constant ambient temperature. A varying duty cycle or an initially hotter transformer is a different case.
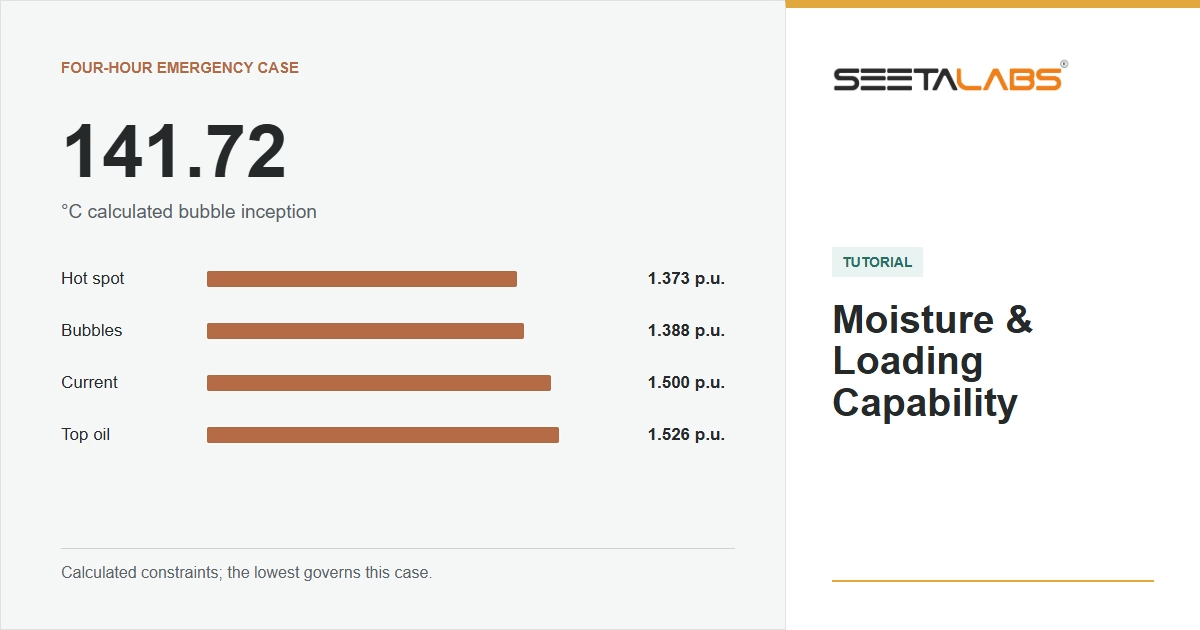
The tool compares four calculated constraints: bubble inception, hot spot, top oil and current. The minimum is the governing constraint within this model, not a complete operating limit for the transformer and its accessories.
Name the model's edition
Seetalabs® Moisture & Loading Capability version 1.0.5 (October 2026) uses the bubble equation in IEEE C57.91-2011 Annex A, Equation A.2, and the thermal model in IEC 60076-7:2018. IEC's published scope covers mineral-oil-immersed transformers, operating temperatures and thermal ageing under different loads and ambient conditions.
The IEEE reference needs a dated qualification. IEEE C57.91-2025 is listed as active, published on 5 March 2026 and superseding C57.91-2011. The tool applies the 2011 Annex A equation; comparison with the 2025 edition has not yet been made. These calculations do not establish equivalence with the current edition.
Reproduce the complete case
The synthetic case uses mineral oil and kraft paper. Karl Fischer water content is 38 mg/kg at 55 degrees C; no dielectric-response moisture result is supplied. Thermal inputs are a 40 MVA ONAN rating, rated top-oil rise of 50 K, rated hot-spot gradient of 23 K and loss ratio R of 5. Preload is 0.7 per unit, the step lasts four hours and ambient temperature is 30 degrees C.
The bubble calculation also needs the assumptions omitted from many abbreviated examples: 760 torr absolute gas pressure above the oil, 1.8 m of oil above the assessed point, density of 880 kg/m3 and the software's air-mode gas-content assumption of 9.6 percent by volume. The additional bubble-temperature margin is zero.
The hydrostatic contribution is approximately 116.51 torr, giving total pressure of 876.51 torr. Gas content here is a software assumption, not a measured DGA result or a universal value for mineral oil.
The preset also contains DP 550. This triggers an aged-paper warning; it does not apply a numerical DP correction to the bubble equation. Retaining that warning is essential when interpreting the numbers.
The selected estimate is not the midpoint
The oil-based calculation returns a selected paper-moisture estimate of approximately 2.082 percent on a dry-paper mass basis, with a range from 2.082 to 3.316 percent. The range spans two implemented curve-based estimates. It is not a statistical confidence interval and is not guaranteed to contain the actual local winding moisture.
The software uses this selected estimate for its headline bubble temperature, but the selected moisture value is at the lower end of this example's range, not its arithmetic midpoint. Treating it as the centre of the range would conceal an important modelling choice.
At the selected estimate, calculated bubble inception is 141.72 degrees C. The four constraints produce approximately 1.388 per unit for bubbles, 1.373 for hot spot, 1.526 for top oil and 1.500 for current. For a four-hour step the tool applies the long-time emergency limits of IEC 60076-7:2018 for a medium power transformer: 140 degrees C hot spot and 115 degrees C top oil (Table 2) and 1.5 per unit current (Table 3). These are the profile settings for this case, not universal limits for every transformer and its accessories.
Hot spot therefore governs the selected calculation at about 1.373 per unit (the tool displays 1.37). The extra decimals are kept only to make the example reproducible; the screen shows rounded values, and the numerical precision should not be mistaken for equivalent accuracy in a real asset assessment.
A small transformer is one without radiators, coolers or tubes, irrespective of its rating (IEC 60076-7:2018 clause 3.1); the corresponding cooling choice is "ONAN, distribution / small". The standard gives no short-time emergency limits for small transformers, so the tool uses the long-time limits (clause 7.3.1). The 40 MVA example above uses the medium-transformer limits.
Change the moisture assumption, not the transformer
At the upper curve estimate of 3.316 percent, with the same pressure and gas content, calculated bubble inception falls to 122.98 degrees C. The corresponding bubble-limited load is approximately 1.213 per unit, below the unchanged hot-spot constraint.
The output retains the selected-estimate headline and reports this wetter case separately. It does not automatically replace its headline with the upper-moisture scenario. A review that records only 1.373 per unit would miss the more restrictive result already present in the calculation.
Likewise, a zero safety margin below the bubble temperature means exactly zero additional margin; the summary then reads "IEEE C57.91 Eq. A.2, no margin". No standard sets a fixed margin for this calculation, so the tool applies the value entered, starting at zero. Entering a margin is not proof that moisture uncertainty, ageing effects and operating risk have all been covered.
What to resolve before an operational decision
Keep the moisture source, temperature, range, pressure basis, gas assumption, thermal inputs, duty and warnings together. A supplied dielectric-response result takes priority in the software, but the resulting single displayed moisture value is not an assertion of zero measurement or interpretation uncertainty.
Missing preload, duration, rating or heat-run inputs leave the thermal assessment unavailable. The input parser rejects values such as "<5" or "ND"; they must not be converted to measured zeros. The bubble model is disabled for aramid paper. Non-mineral liquids generate mineral-basis warnings and are outside this worked example's validation.
The useful outcome is a sensitivity assessment and a list of evidence to improve. It is not permission to conduct an overload test, a drying instruction or a declaration that operation below the displayed number is safe. Any operational decision still needs asset-specific engineering review, the applicable guidance, manufacturer restrictions and checks beyond these four constraints.
Explore the assumptions in Moisture & Loading Capability.