Is the annual average ambient temperature enough to check a transformer site?
No. IEC 60076-1:2011, clause 4.2, sets separate upper limits for cooling-air temperature at any time, for the hottest monthly average and for the yearly average, and passing one check does not cancel a failed one. Use air at the cooling-equipment inlet, treat gridded climate data as an estimate rather than a site record, and keep specification checks separate from an operating load rating.
An annual average can conceal a cooling problem in August. A short temperature peak can exceed the original design basis even where the monthly average remains modest. Transformer ambient temperature therefore needs several checks, with different meanings: service conditions, temperature-rise requirements and loading under a stated duty.
A climate calculation can support those checks. This article uses Seetalabs® Site Climate & Loading version 1.0.8 (October 2026). It cannot turn a regional climate signal into a guaranteed site temperature, or an ageing comparison into an authorised load rating.
On this page (5 sections)
Start With the Air Entering the Cooler
IEC 60076-1:2011, clause 4.2, specifies upper cooling-air temperatures of 40 C at any time, 30 C for the hottest monthly average and 20 C for the yearly average, with normal altitude up to 1000 m. These are not interchangeable limits. Passing the annual check does not cancel a failed maximum-temperature check. Nor do these four checks cover every service condition in the standard: minimum temperatures, voltage, installation and other conditions still matter.
The temperature definitions also matter. Under clauses 3.12.2 and 3.12.3, the monthly figure combines the averages of daily maxima and daily minima over many years; the annual figure averages the twelve monthly values equally. It is not necessarily the same as averaging every hourly temperature in the year.
The relevant air is at the cooling-equipment inlet. NASA POWER supplies gridded meteorological estimates, not a thermometer at that inlet. Its MERRA-2 meteorology uses a 0.5-degree latitude by 0.625-degree longitude grid, and daily extrema come from hourly values. A grid-cell maximum is not a site record or a future design extreme. Local elevation, ventilation, recirculated hot air and nearby surfaces require separate evidence. NASA POWER meteorological methodology
A Specification Check Is Not a New Operating Rating
IEC 60076-2:2011, clause 6.3.2, adjusts temperature-rise limits for unusually high cooling-air temperatures. Its altitude correction concerns factory testing relative to the installation altitude: for a site above 1000 m and a factory not above that height, the correction is 1 K per 400 m for natural-air cooling or per 250 m for forced-air cooling, rounded to whole kelvin. The tool applies this correction from the site altitude alone, which assumes a factory at or below 1000 m. For a factory above 1000 m, the clause allows a corresponding reverse correction, to be agreed with the manufacturer.
Where several ambient excesses differ, the tool shows the range of corrections and prints the limits for the largest; the altitude correction is added separately. That is its declared interpretation, not an explicit rule resolving every combination in the clause. The tool checks service conditions before rounding the correction: a 40.4 C maximum is labelled "Outside normal conditions, correction 0 K". Missing maximum-temperature data does not erase an exceedance already established by another criterion.
These calculations inform specification and acceptance discussions with the manufacturer. They do not rewrite an existing nameplate or establish that bushings, leads, tap-changers and cooling equipment permit the calculated load.
Read the Historical Example with Its Data Period
The following Rome calculation uses monthly values from NASA POWER (2001-2020), rounded, as used in the tool's example. It is not a fresh weather download or a measurement campaign at a transformer. The app downloads the last twenty complete years, so its results for Rome will differ from this fixed example. January through December, in C:
7.52, 8.04, 10.72, 14.10, 18.12, 22.80, 26.13, 26.47, 21.86, 17.72, 12.95, 8.63
Their annual average is 16.255 C; August is highest at 26.47 C. The example's maximum is 40.92 C, and it uses 198 m altitude. Only the maximum exceeds the four upper-temperature/altitude criteria. Its 0.92 K excess produces a 1 K correction: the illustrative ONAN rise limits become 59 K for top oil, 64 K for average winding and 77 K for hot spot.
NASA POWER is a NASA Langley Research Center project supported by NASA's Earth Science Division. The historical example is attributed to the POWER Daily service; its original retrieval date and saved source response are unavailable, so the exact input dataset cannot be independently reconstructed here. For new calculations, retain the service version and access date with the downloaded data, as requested by the NASA POWER referencing guide.
For the thermal calculation, take a mineral-oil ONAN unit with ordinary kraft paper, rated top-oil rise 52 K, hot-spot-to-top-oil gradient 26 K and rated load-loss/no-load-loss ratio R = 6. These are example inputs, not values inferred from the weather. No enclosure correction or operating load profile is included.
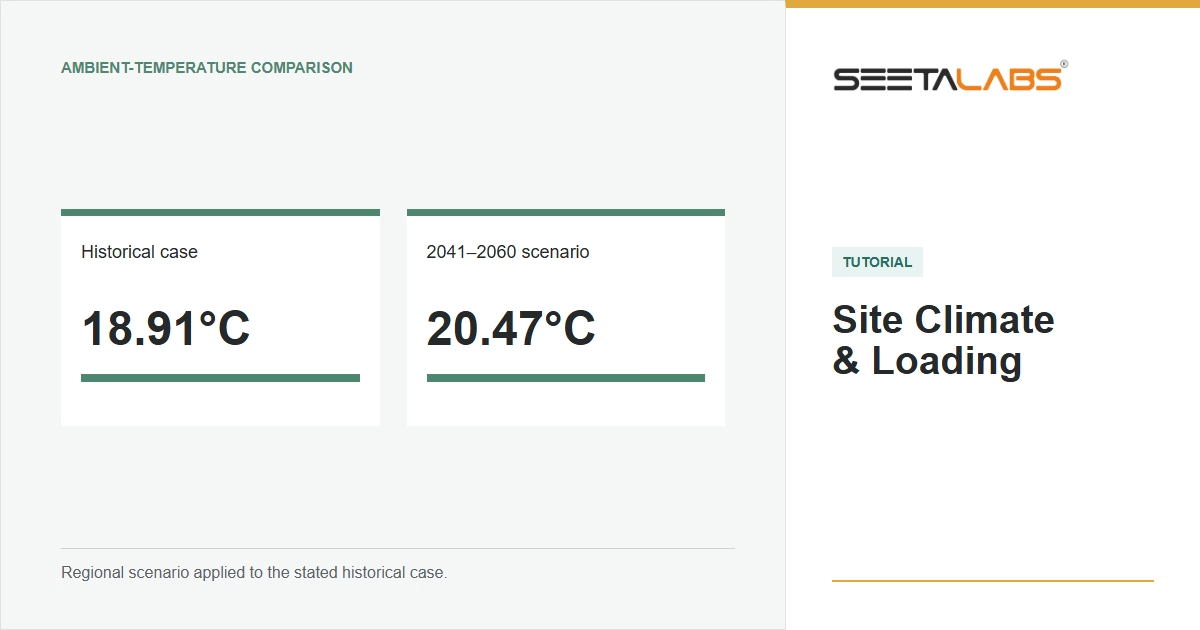
The annual weighted ambient theta E is about 18.91 C using the implemented Equation 27 of IEC 60076-7:2018, clause 8.3.1. That approximation assumes sinusoidal ambient variation and an ageing rate doubling every 6 K. It is not a measured temperature or a universal replacement for a time history. Dynamic loading needs an actual temperature profile. The guide's stated scope is mineral-oil-immersed transformers. IEC publication description
Holding ambient at the hottest monthly mean, the steady-state model reaches a 98 C hot spot at approximately 0.9373 p.u. load. This is a thermal comparison at a selected reference temperature. It is neither a complete operating limit nor an emergency-loading permission.
The Period Changes the 2050 Result
Here, "2050" means the 2041-2060 period, not a forecast for one summer. The tool derives monthly changes from CMIP6 regional land-temperature data for the Mediterranean AR6 region under SSP2-4.5, against 1995-2014. The source contains regional averages, not transformer-site projections. IPCC-WG1 regional dataset documentation
The software then applies its own linear adjustment for the age of the historical baseline. For 2001-2020, the midpoint is 2010.5 and the delta multiplier is:
1 - (2010.5 - 2004.5) / (2050.5 - 2004.5) = 40/46 = 0.869565
With that period supplied, August's raw 2.05 K regional change becomes about 1.783 K. August reaches 28.253 C, weighted ambient becomes 20.471 C, and the same thermal model gives 0.9197 p.u. at 98 C. That is about 1.88% below the historical comparison, not 1.88% less transformer life.
A calculation that omits the period applies the full delta, producing approximately 20.705 C and 0.9170 p.u. Those numbers answer a different calculation. The current app requests the last twenty complete years, which in 2026 means 2006-2025; its multiplier is 35/46. Do not attach that period to the old Rome temperatures and call the result current.
The software also shifts the historical maximum by a monthly mean-temperature delta, leaving the daily range unchanged. In the period-aware example this gives 42.703 C and illustrative rise limits of 57/62/75 K. That maximum is an assumption, not a modelled extreme-temperature statistic suitable on its own for procurement. Likewise, the displayed model-percentile range is not a confidence interval for this installation.
What to Check Before Using the Result
Retain the data period, source version, retrieval date, coordinates, scenario and thermal inputs together. Resolve missing data and compare the gridded series with representative local records. Replacing a grid altitude with the site's altitude does not itself correct the gridded temperature for elevation.
For an operating decision, add the load history, cooling condition, applicable component limits and uncertainty in the heat-run parameters. The short calculation above includes neither moisture and oxygen effects nor direct solar and wind effects on the transformer. It reports no remaining life.
Selecting a location in this software initiates a NASA request automatically. The application rounds coordinates to 0.1 degrees and omits browser credentials and referrer from that request. This is not anonymity: the remote service still receives the network connection. No claim about the provider's logging follows from client-side calculation.
Discuss the site evidence and proposed duty with an engineer before changing the specification or operating load.
Compare your site in Site Climate & Loading.