What does delta DGA show, and when is subtracting an earlier gas sample valid?
Delta DGA is the change in each gas concentration between two comparable samples, not a direct measurement of gas generated by a new fault. CIGRE TB 771 (2019), Appendix H.6, uses subtraction to expose a new pattern superimposed on an earlier one. Before plotting increments, confirm comparable methods and compartments, a justified baseline, differences larger than measurement uncertainty and no treatment or venting between samples.
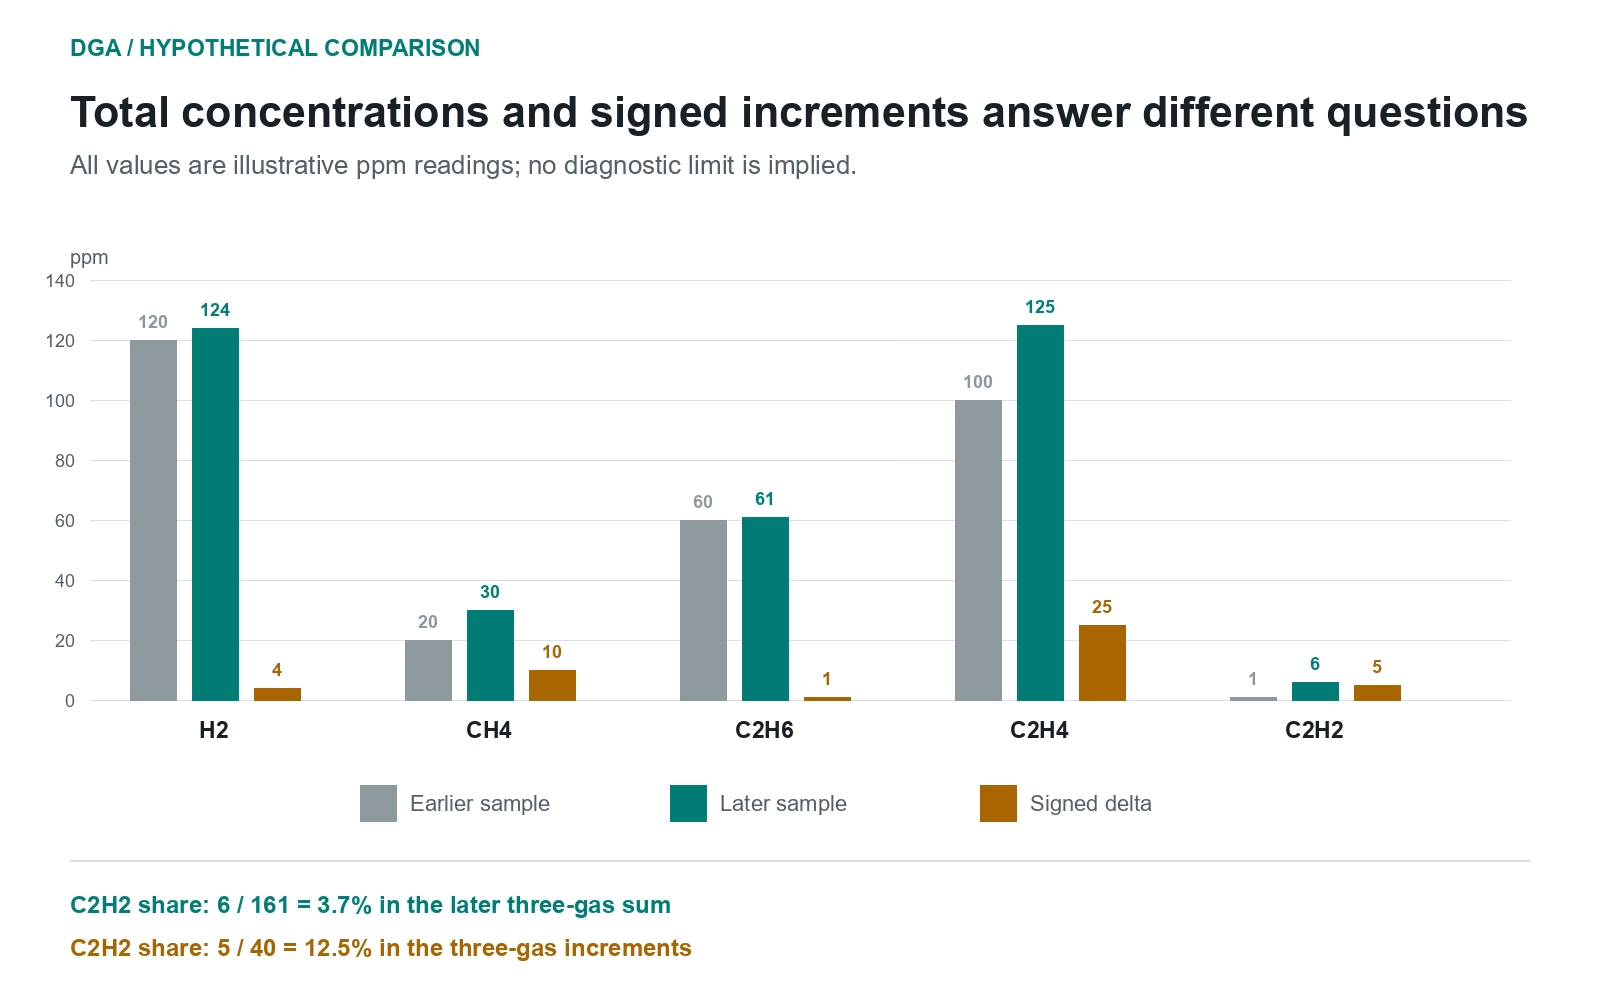
Ethylene has been elevated for years. The latest sample adds a smaller acetylene increase, but a diagram of the total concentrations still looks dominated by the old thermal pattern. Delta DGA asks a narrower question: what changed between two comparable observations?
Subtracting earlier concentrations can expose that contribution, but a positive difference is not automatically newly generated gas. Sample comparability and the choice of baseline determine whether subtraction helps.
What delta DGA measures
For each gas, calculate the later concentration minus the earlier concentration. Preserve the result in the same units and retain both original samples. This produces a vector of observed concentration changes, not a direct measurement of the gases generated by a newly located fault.
CIGRE TB 771 (2019), Appendix H.6, discusses subtraction when a new gas pattern is superimposed on an earlier one. Its purpose is diagnostic discrimination. It does not remove the need to check measurement quality, gas losses, treatment and changing operating conditions.
Delta DGA and a gas-generation rate are different outputs. The first is a change in concentration; the second introduces time or a fitted history. Keep the interval visible even when only the delta is plotted. A month and five years are very different contexts for the same increment.
A worked hypothetical comparison
Assume two mineral-oil main-tank samples have comparable methods, units and quality, with no documented oil intervention between them. The numbers below are invented and do not represent diagnostic limits.
| Gas | Earlier sample, ppm | Later sample, ppm | Observed delta, ppm |
|---|---|---|---|
| Hydrogen | 120 | 124 | +4 |
| Methane | 20 | 30 | +10 |
| Ethane | 60 | 61 | +1 |
| Ethylene | 100 | 125 | +25 |
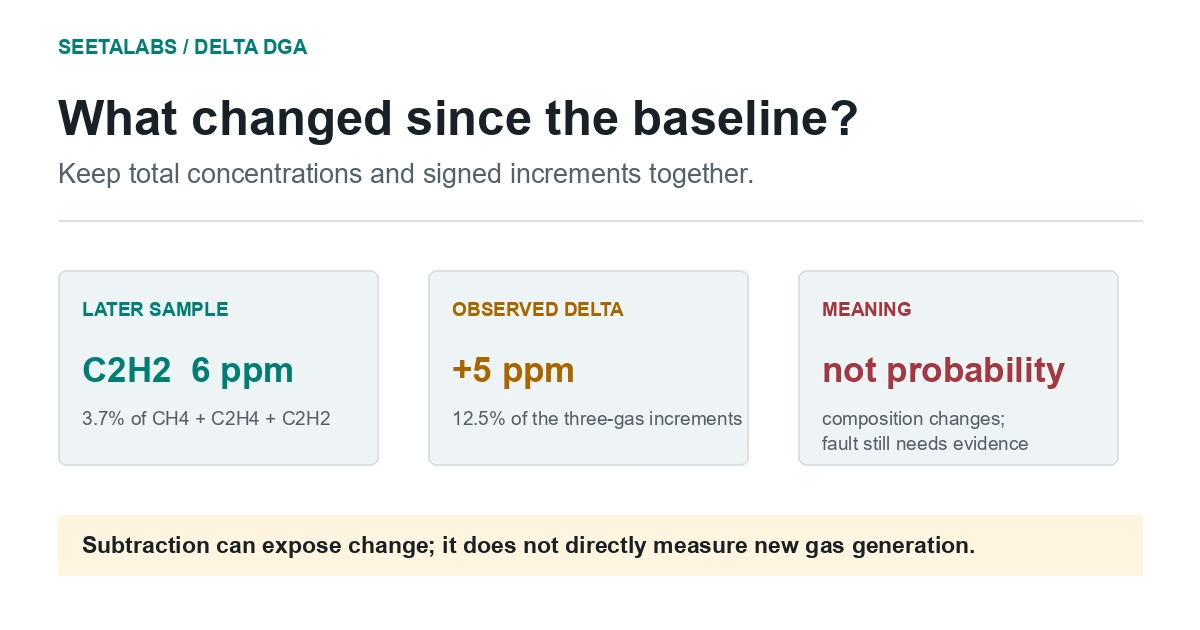
| Acetylene | 1 | 6 | +5 |
In the later sample, acetylene is about 3.7% of the methane-plus-ethylene-plus-acetylene sum: 6 divided by 161. In the increments, it is 12.5%: 5 divided by 40. This arithmetic illustrates how a historical background can mask the relative importance of a recent contribution.
It does not establish a Duval category, an energy level or a physical fault location. Before plotting the increments, check whether each difference is meaningful relative to the uncertainty of both measurements. The +1 ppm ethane change, for example, cannot be assumed significant merely because subtraction produced a positive number.
Also ask whether the earlier sample is a defensible baseline. Choosing an unusually low historical result can manufacture a larger increment. A baseline should be justified by the chronology and condition being investigated, not selected to produce a preferred diagnosis.
Negative values are evidence to retain
A negative delta may reflect measurement variability, gas loss, redistribution or an intervention. It is evidence to investigate, not a faulty number to delete.
CIGRE TB 771, Appendix H.6, describes replacing negative increments with zero for the specific purpose of identifying a new fault from delta values. That plotting convention should be explicit. Preserve the signed changes separately and record why the subtraction remains useful despite those decreases.
For example, if a calculation changes -10 ppm hydrogen to zero, the plot must be labelled as a transformed delta representation. It should not be presented as a directly measured gas sample. Broad decreases after degassing are a reason to segment the history, not an invitation to clip every negative value and diagnose the few positive ones.
A censored result needs separate treatment. Earlier acetylene <0.5 ppm and later acetylene 1.2 ppm do not give an exact measured delta of 1.2 ppm. Retain the qualifier. Any sensitivity calculation using assumed below-limit inputs must be labelled as such; the reporting limit is not a guaranteed bound on the true concentration.
Decide whether subtraction adds useful evidence
Review the total gas pattern, signed increments and time history together. Before requesting a delta classification, record four decisions:
- Which earlier sample is the baseline, and why does its date fit the event being investigated?
- Are fluid, compartment, units and analytical methods comparable?
- Which differences are resolved well enough to interpret, given both measurements' uncertainty?
- Did treatment, venting or another event change the gas inventory between samples?
An unresolved answer belongs beside the plot, not in a hidden calculation note. The Duval Triangle guide explains the role of classification within a wider DGA assessment. Subtraction should clarify that assessment without replacing the original concentrations.
References: CIGRE TB 771 (2019), Appendix H.6, p. 70; IEEE C57.104-2019, Clauses 5.1-5.2 and Annex B, p. 50. Relevant licensed passages checked as of 25 September 2026. The table and calculations are hypothetical; the review checklist is editorial guidance, not a fault-classification rule.