
CO and CO2 can inform a paper-insulation assessment but cannot establish paper condition alone. When their ratio changes, first ask which gas, intervention or sampling condition changed.
This concerns mineral-oil, cellulose-insulated equipment; ester and separate-compartment interpretations need their own basis.
What Carbon Oxides Can Tell You
IEC 60599:2022, clause 5.5, discusses CO2/CO with background and corroborating evidence, not as a paper-life calculation.
Carbon oxides can reflect cellulose degradation, but oil oxidation and equipment history complicate attribution. Local damage may not dominate bulk-oil gas. The previously reviewed chemical-indicator survey treats CO and CO2 alongside other evidence, not as exclusive paper markers.
Separate a paper-involvement hypothesis from remaining mechanical strength. A ratio answers neither by itself; use the wider DGA context.
Read the Numerator and Denominator First
This original table is a review aid, not a diagnostic rule.
| Observed pattern | Why the ratio alone is insufficient | Useful follow-up |
|---|---|---|
| CO increases while CO2 is stable | The ratio falls through a changing denominator | Verify CO trend and accompanying fault gases |
| Both gases fall after degassing | An intervention changed the gas inventory | Mark the event and establish a new baseline |
| CO2 varies with operating conditions | Distribution and background can affect the sample | Align gas results with load and temperature history |
| CO is below the detection limit | An exact ratio cannot be calculated | Preserve the censored result and laboratory limit |
| One sample differs greatly from the series | Sample identity or method may be involved | Check certificate, valve, compartment and repeatability |
Unmeasured or below-detection gas is not zero. Substituting a detection limit creates a stated boundary assumption; if conclusions change with that assumption, leave them unresolved.
Concentration change divided by time is not total gas production; treatment, gas exchange and sample comparability intervene.
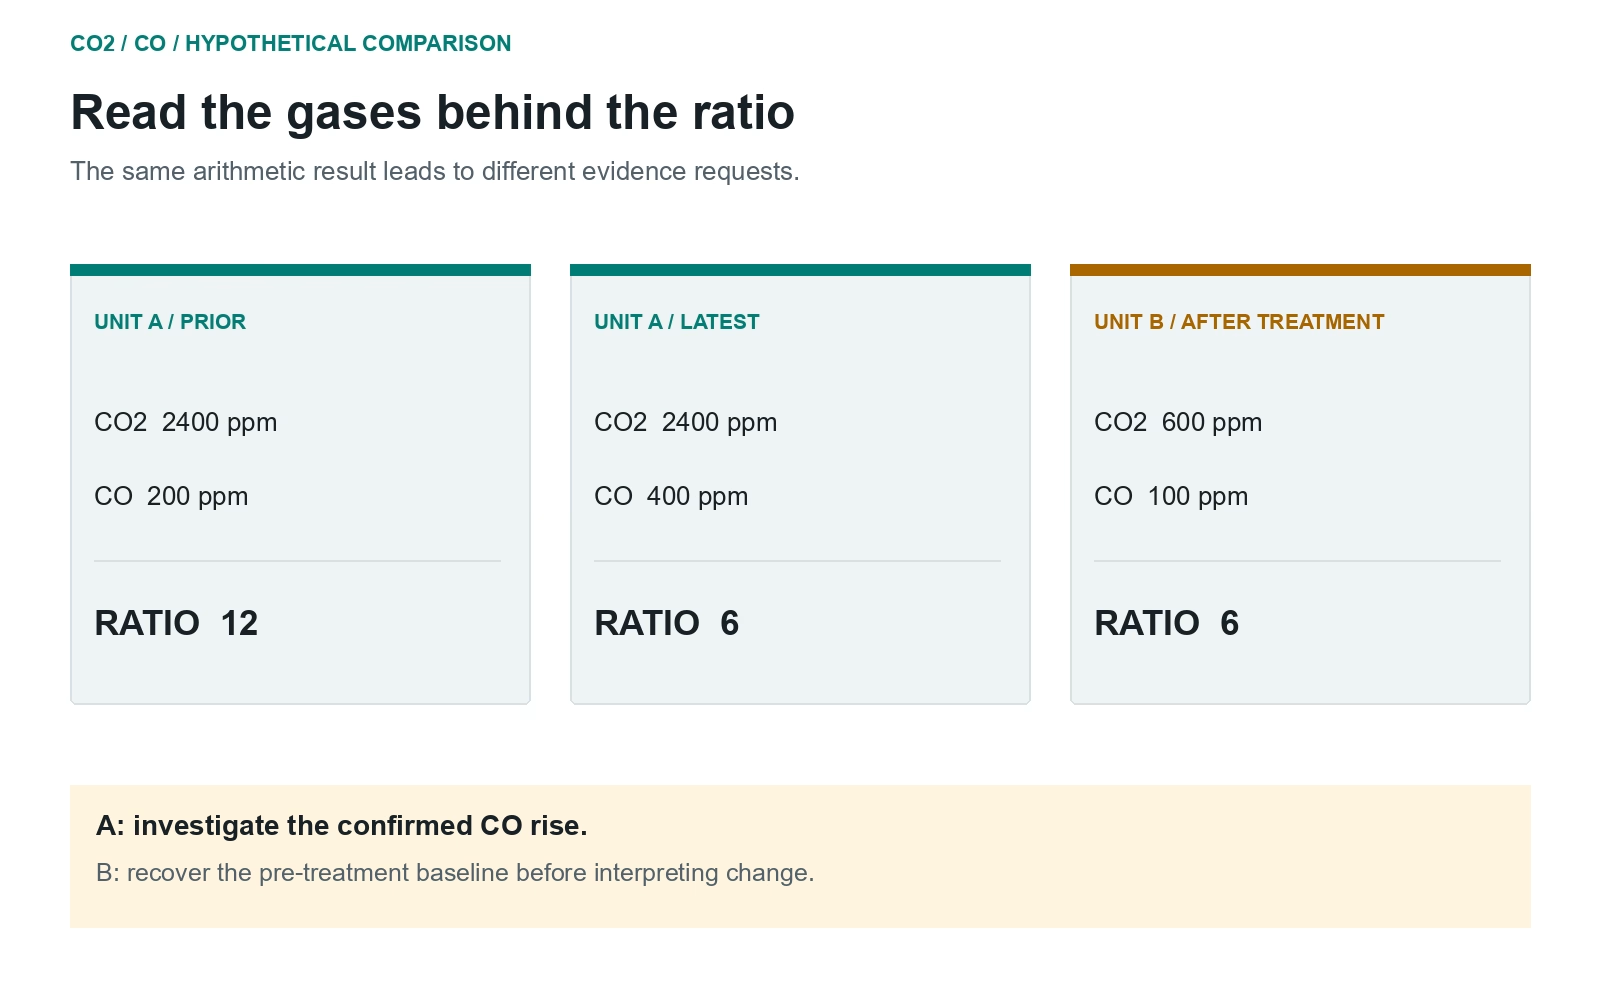
Worked Example: The Same Ratio, Different Histories
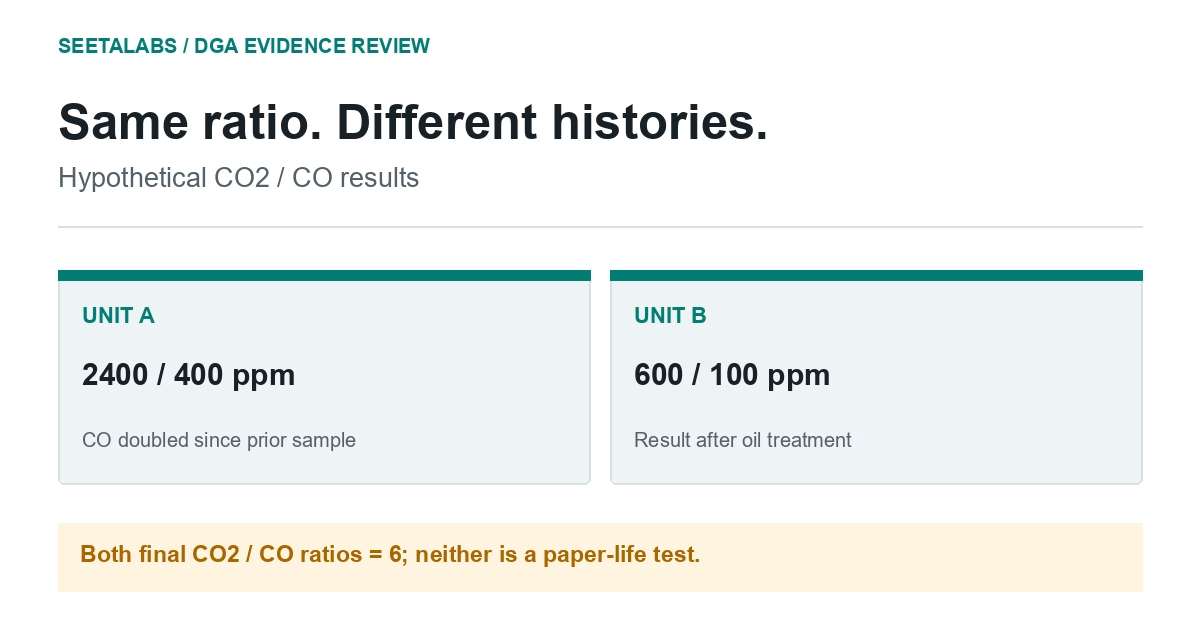
Hypothetical, not diagnostic limits: Unit A moves from CO2 = 2,400 and CO = 200 ppm to CO2 = 2,400 and CO = 400 ppm. CO2/CO falls from 12 to 6. Unit B measures CO2 = 600 and CO = 100 ppm after oil treatment, also giving 6.
The same final ratio conceals different histories: A's CO doubled; B has another concentration scale and a treatment discontinuity.
For A, check interval, method, other gases, thermal history and relevant furans. For B, retrieve pre-treatment samples and treatment details before claiming a trend.
Confirm asset and compartment. Neither ratio gives exact DP or remaining life.
Report the Finding With a Clear Boundary
Report observation, alternatives and next evidence: a confirmed CO rise warrants full gas-pattern, cellulose-marker and temperature-history review by the responsible engineer.
Neither a familiar nor unusual ratio alone authorises an operating decision. The normal-gas discussion gives related context.
Plot both gases separately and mark interventions before interpreting the ratio.
Sources and scope: IEC 60599:2022, clause 5.5, printed page 15, checked in the licensed local extraction in the earlier review; official scope rechecked 29 September 2026. The linked 2021 survey is secondary, assessed previously but not newly accessible. Table and arithmetic example are original; no standard threshold table is reproduced.