Should a DGA result reported below the detection limit be entered as zero?
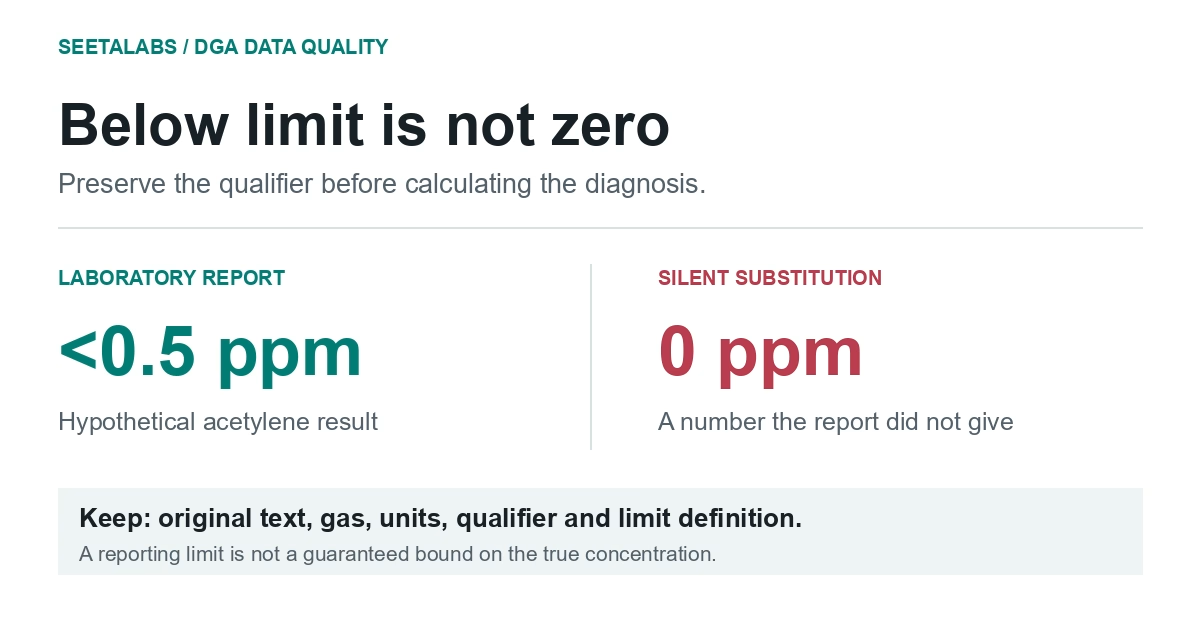
No. A result such as <0.5 ppm is a qualified report, neither a measured zero nor an exact concentration, and replacing it with zero or half the limit assigns a value the laboratory did not measure. That substitution can change ratios, trends and fault labels. Store the original text and qualifier separately from the numeric field, and flag any entry the import cannot represent for review.
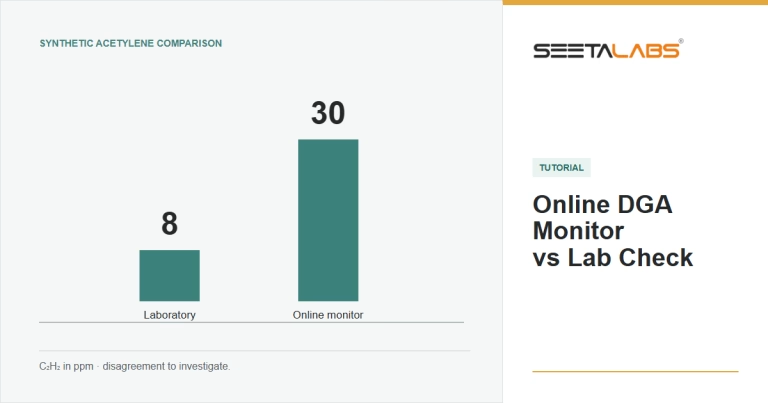
The laboratory reports acetylene as <0.5 ppm. Your spreadsheet imports it as 0. The next sample contains a reported 0.4 ppm from a method with a lower detection limit, and the dashboard announces that acetylene has appeared.
What appeared may be a measurement capability, not a new gas source. DGA below detection limits needs explicit handling because a lost qualifier can change ratios, trend calculations and fault labels. The same problem occurs when a blank field is interpreted as a measured zero.
Read the qualifier before the number
A result such as <0.5 ppm is a qualified report, not a measured zero or a guaranteed upper bound on the true concentration. Ask what the limit means. Below a detection limit (LOD), detection is not reliable at the method's stated confidence. A detected result below a quantification limit (LOQ) cannot be quantified with the laboratory's specified performance. A reporting limit may follow another convention.
Eurachem's 2025 method-validation guide, Sections 5.3.1 and 5.3.4, explains that distinction. It addresses analytical performance, not transformer alarm limits.
IEEE C57.104-2019, Clause 5.2.1, warns that relative uncertainty can be large near the method's detection capability. A result can be numerically present in a report yet still be unsuitable for confident fault identification.
| Report entry | What to preserve | What it does not establish |
|---|---|---|
| <0.5 ppm | Less-than qualifier, limit, gas and units | Exact zero or an exact concentration |
| ND | Original text and laboratory definition | A universal detection limit |
| Not tested | Missing measurement status | Absence of the gas |
| Blank cell | Unresolved reason for missingness | Permission to substitute zero |
| 0.0 ppm | Reported value and rounding/reporting policy | An ability to detect arbitrarily small concentrations |
| Estimated value below quantification limit | Value plus estimation qualifier | Precision equivalent to routine quantified results |
Work through the effect on a ratio
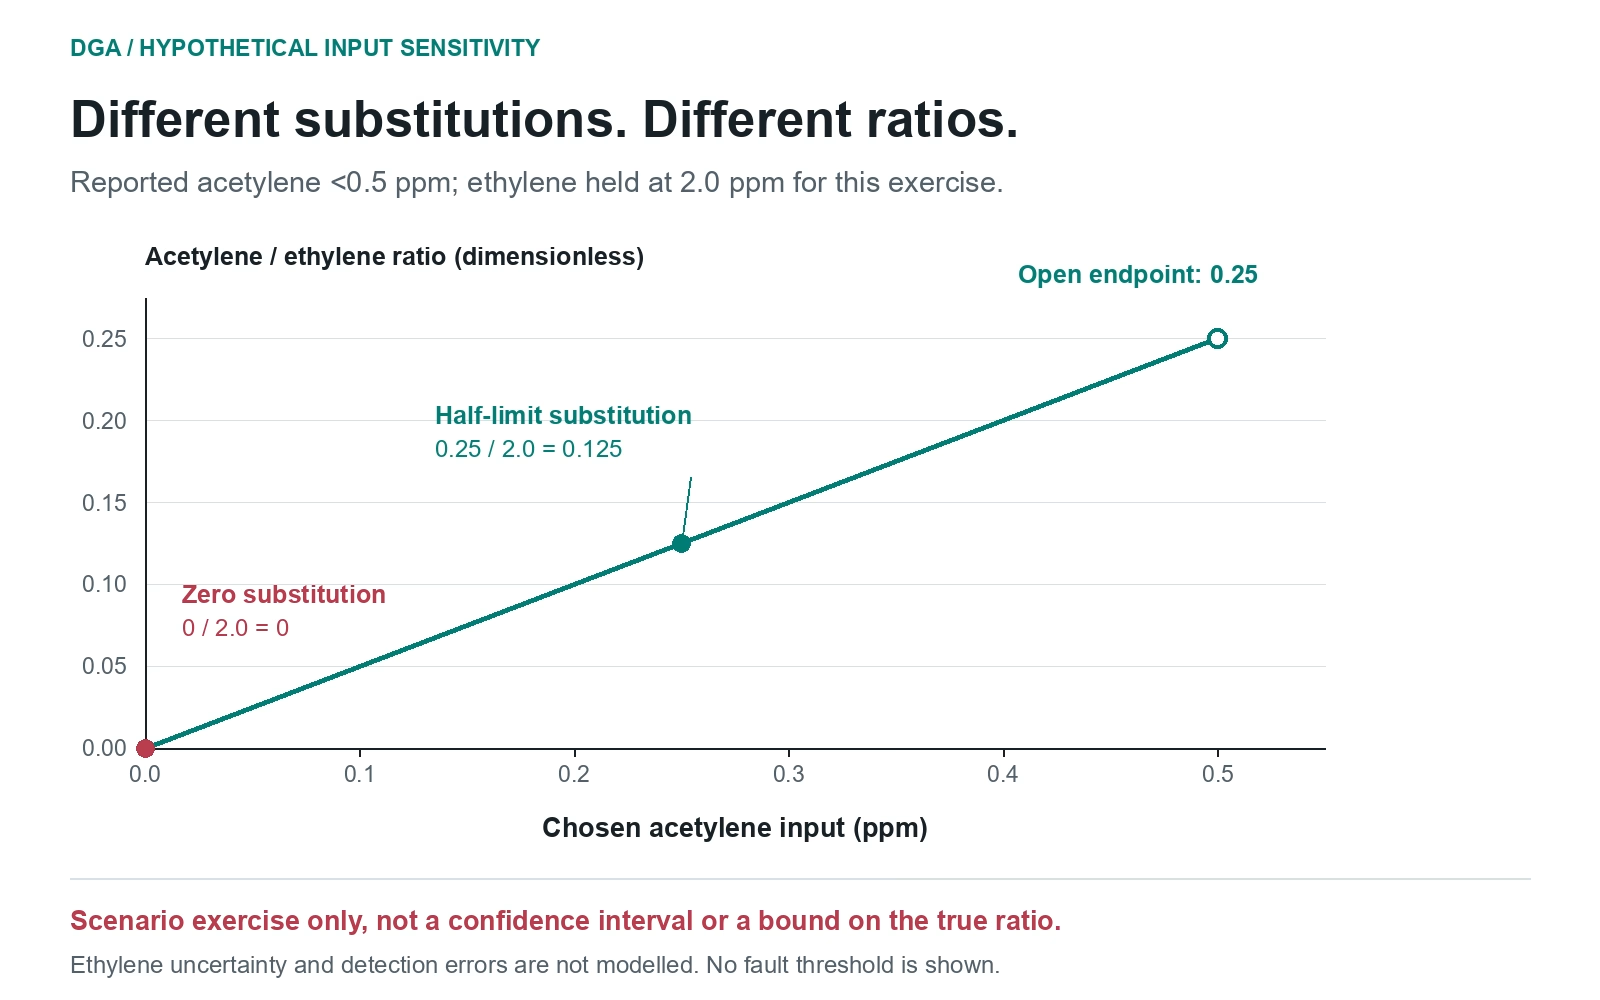
Take a hypothetical report with acetylene <0.5 ppm and quantified ethylene of 2.0 ppm. To test the effect of substitution, choose acetylene inputs from zero to just below 0.5 and temporarily hold ethylene at 2.0. The calculated acetylene/ethylene ratios range from zero to just under 0.25.
This is a deliberately restricted input scenario, not a confidence interval or a complete range of possible true ratios. It ignores ethylene uncertainty and does not model detection errors. Its purpose is to expose the effect of a data-handling choice, not recover a concentration the laboratory did not quantify.
Replacing acetylene with zero fixes the ratio at zero. Replacing it with half the limit fixes it at 0.125. Either choice assigns a single value that the laboratory did not measure. Half-limit substitution may have a declared role in a particular statistical analysis, but it is not a universally valid input for a single-transformer diagnosis.
The denominator matters even more. If ethylene is also reported below a limit, the ratio can become unstable or undefined under plausible inputs. A calculator should then make the uncertainty visible or withhold classification, rather than select an arbitrary tiny denominator.
Check whether an apparent trend is measurable
Return to the opening example. Sample A is <0.5 ppm and sample B is reported as 0.4 ppm by another method. Those entries alone establish neither the direction nor size of a change.
Now suppose B is 1.2 ppm with adequate quantification and the same asset and compartment are confirmed. The evidence for an increase is stronger, but its size and significance still depend on the methods, reporting bases and sampling quality. Do not calculate a percentage increase from an invented zero.
Ask the laboratory for gas-specific limits, relevant uncertainty information, any method change and clarification of the original result. Keep those details with the sample. The DGA guide explains the broader separation between data review and interpretation; the Duval Triangle guide explains why a plotted point alone is insufficient.
Repair the data path before refining the diagnosis
Review a recent report from PDF through spreadsheet to final assessment. Confirm that qualifiers survive every transfer. Store the original text separately from the numeric field, and retain the sample's source and method. An automated import that cannot represent <LOD should flag the entry for review.
Report whether the classification changed across the documented input scenarios, remained unchanged in those scenarios, or could not be calculated. Do not describe a small scenario set as proof of robustness across all possible inputs.
Request clarification from the laboratory when the qualifier's meaning is missing. The responsible engineer can then choose confirmation or further testing in the context of the asset and any independent alarms.
References: IEEE C57.104-2019, Clause 5.2.1, pp. 26-27; Eurachem, The Fitness for Purpose of Analytical Methods, third edition (2025), Sections 5.3.1 and 5.3.4, pp. 31 and 34. Relevant text checked as of 25 September 2026. The table is an editorial data-handling aid; the ratio exercise is hypothetical, not a fault threshold or probabilistic model.