
DGA gas generation rates can look dramatic when a small change is divided by a short interval. Two observations describe that interval, not a persistent process or an automatically qualifying multipoint rate.
Assess trend quality separately from whether the absolute dissolved gas levels are unusual. One can change without the other.
1. Separate concentration change from fitted rate
A concentration increment is the later value minus the earlier value, in ppm on the stated reporting basis. Divide by elapsed time for an interval slope; fit several observations for a multipoint estimate.
IEEE C57.104-2019, Clause 3.1, defines its rate using a linear fit to three to six consecutive DGA samples over four to twenty-four months. Clause 6.1.1 and Annex B distinguish consecutive-sample increments from multipoint rates. Other calculations are possible, but must not be presented as this specific standard comparison without satisfying its conditions.
The guide's mineral-oil transformer scope does not establish equivalent criteria for esters or OLTC compartments. Table notes and reference-population criteria also matter; sample count and window alone are insufficient. Do not delay an investigation to complete a statistical screen.
2. Decide what the history can support
| Available history | Defensible output | Main limitation |
|---|---|---|
| One valid sample | Concentration and contextual review | No observed rate |
| Two comparable samples | Increment and labelled interval slope | Cannot establish persistence |
| Several compatible samples within a qualifying window | Fitted rate with documented eligibility | Fit can conceal a step change |
| Closely spaced confirmation samples | Evidence about reproducibility or an event | Annualisation magnifies small differences |
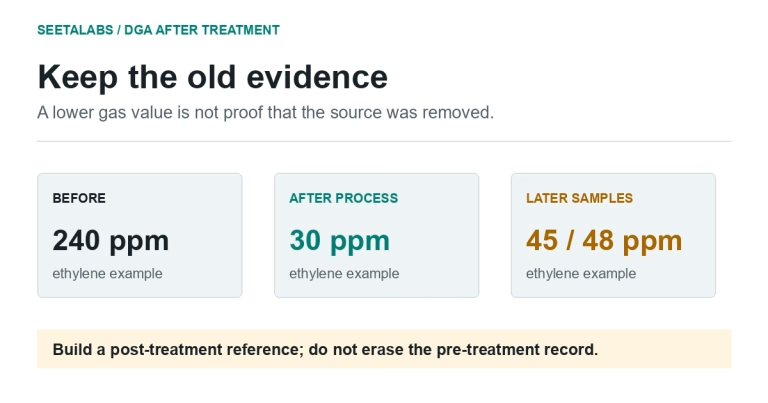
| Samples spanning degassing or oil replacement | Separate before/after segments | One continuous slope misrepresents intervention |
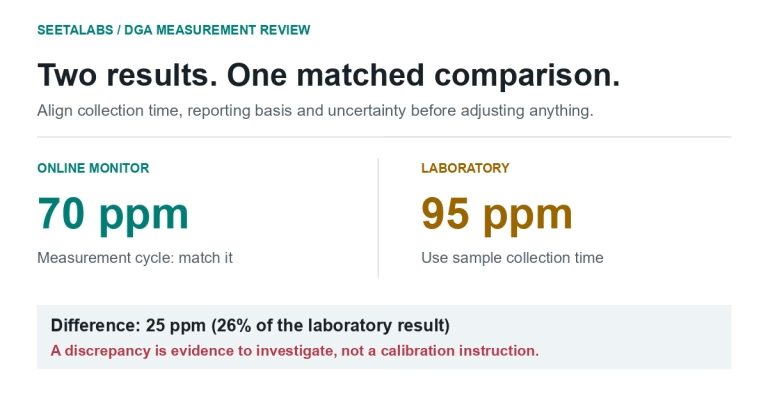
| Mixed laboratories or monitor/lab history | Comparison pending compatibility review | Method differences can mimic change |
Use collection dates, not report dates. A duplicate analysis of one bottle is not another independent transformer observation.
Concentration slope is not total gas production: losses, redistribution and oil interventions also affect dissolved concentration.
3. A worked hypothetical example
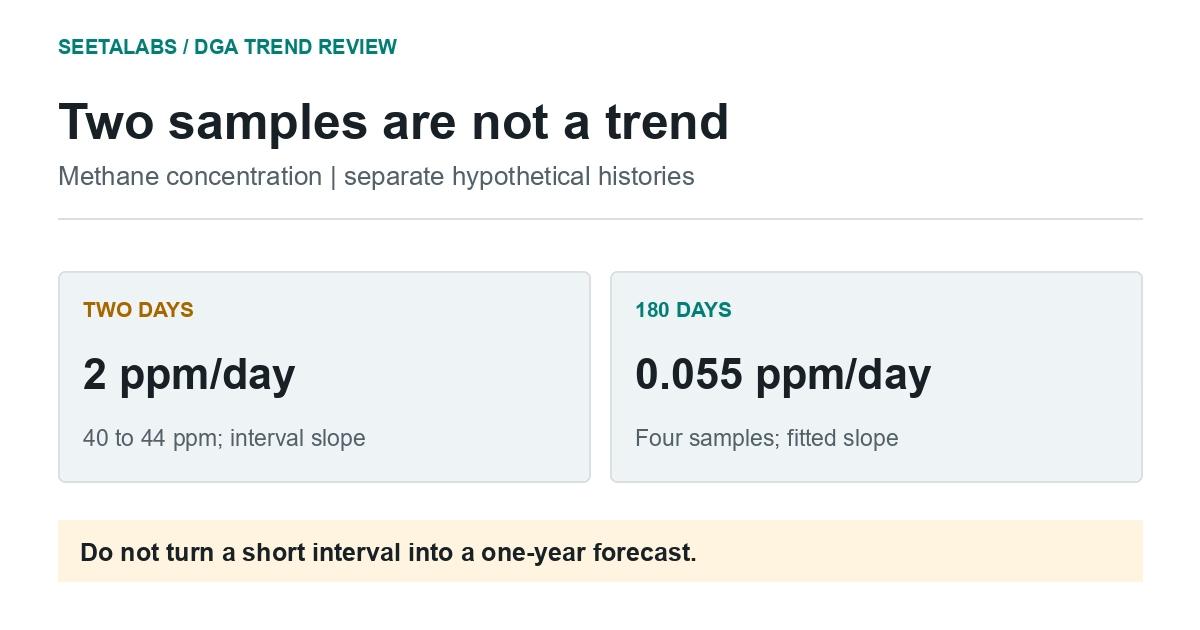
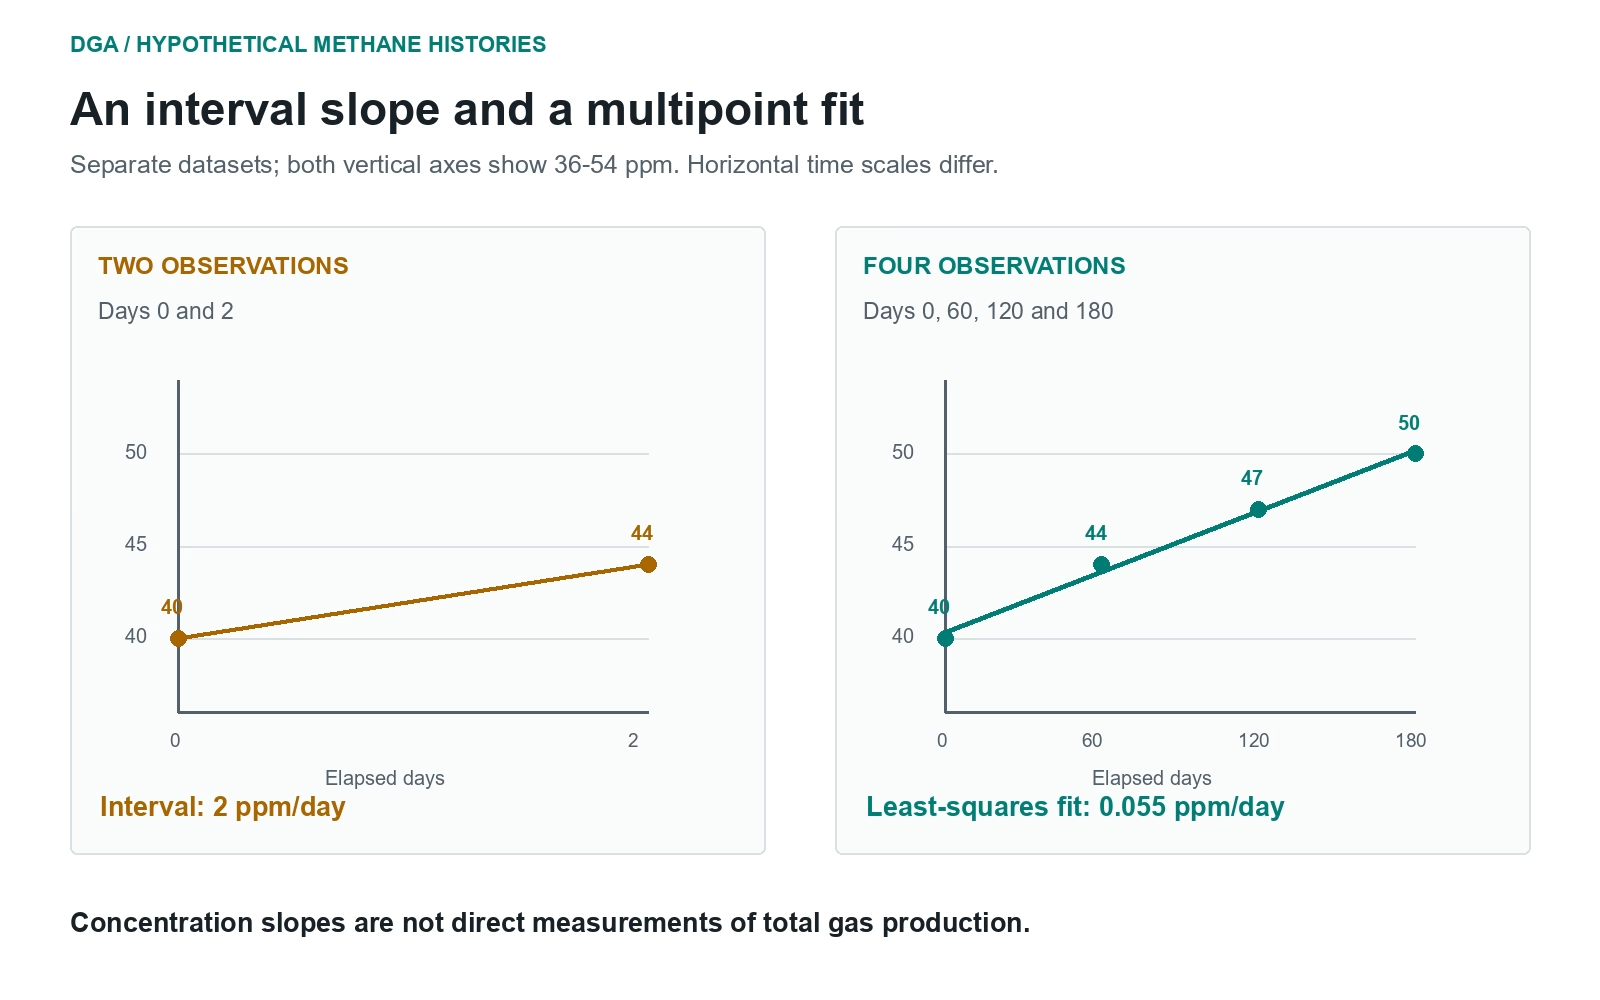
Methane changes from 40 to 44 ppm over two days: 2 ppm/day, or 730 ppm/year if annualised. That extrapolation does not show that methane was generated at this rate for a year.
Separately, four comparable observations on days 0, 60, 120 and 180 measure 40, 44, 47 and 50 ppm. Mean time is 90 days; mean concentration is 45.25 ppm. The least-squares numerator is 990 ppm-days and denominator 18,000 days squared: 0.055 ppm/day, about 20 ppm/year. These are neither a threshold nor a condition classification.
Check measurement and sampling variability before interpreting either calculation. The longer series gives more directional evidence, but still needs operating-context and standard-eligibility review.
A different history could hold near 40 ppm for three samples, then jump to 50 ppm after an event. A fitted line may describe that step poorly. Plot observations and event dates.
4. Build a rate statement someone can audit
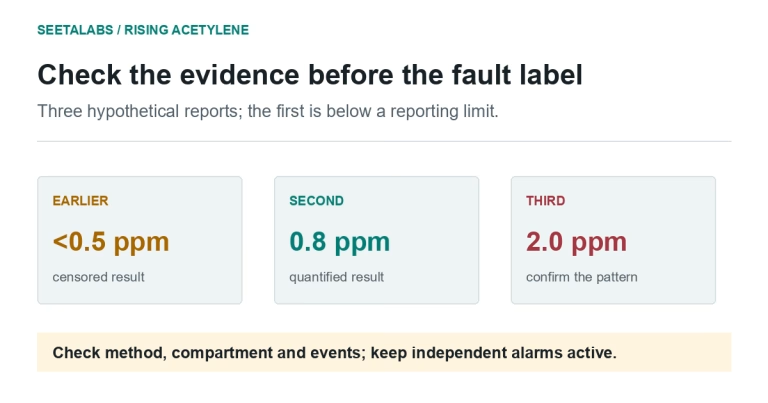
State the gas, collection dates, units, method and exclusions with reasons. Mark treatment and operating events; preserve below-limit qualifiers instead of turning them into zero. Keep the calculation within the wider condition-monitoring review.
IEEE C57.104-2019, Annex B, printed page 50, discusses short intervals, incompatible sources and maintenance effects, not automatic operate-or-stop decisions.
References: IEEE C57.104-2019, Clauses 1.1/1.3, pp. 13-14; rate definition in Clause 3.1, p. 17; Clause 6.1.1 and Annex B, including p. 50. Relevant licensed passages checked as of 25 September 2026. The table is an editorial aid; worked values are independently calculated hypotheticals.