If a partial discharge survey is quiet, can I dismiss rising hydrogen in the oil?
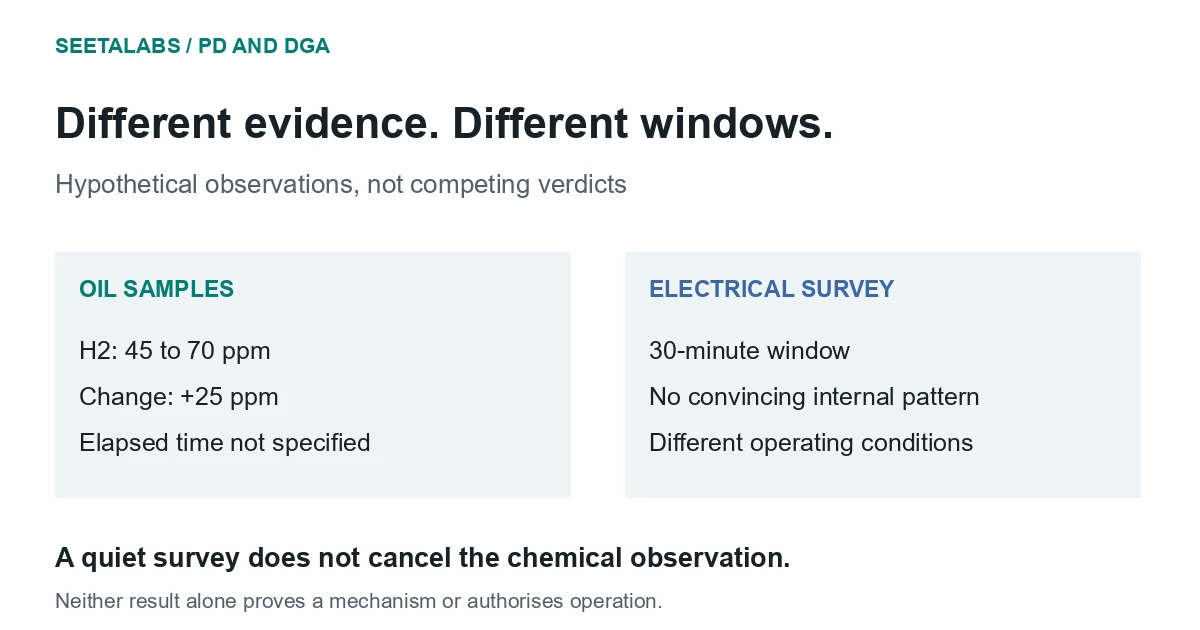
No. Electrical partial discharge measurements and dissolved gas analysis observe different things over different time windows, so a quiet survey does not cancel a verified gas trend, and rising hydrogen alone does not prove partial discharge. Compare compartment, measurement interval, operating conditions and detection limits before treating agreement or disagreement as evidence, and state only that the survey found no convincing activity during its documented interval.
Electrical partial-discharge measurements and dissolved gas analysis cover different observations and time windows. A quiet PD survey does not cancel a verified gas trend; rising hydrogen alone does not prove PD. To reconcile the results, compare compartment, measurement interval, operating conditions and detection limits before treating agreement or disagreement as diagnostic evidence.
Establish What Each Measurement Actually Represents
IEC 60270:2025 covers charge-based partial-discharge measurements. Its verified catalogue scope includes measurement quantities, calibration and distinguishing PD from external interference. Scope verification is not a full-text review of its requirements. A UHF sensor output, an acoustic signal and a calibrated apparent-charge measurement should retain their own quantities and units; do not treat them as interchangeable readings.
DGA is a chemical observation from a sampled fluid volume. Electrical PD testing records signals during its measurement interval. Ranninger and Kruger's original transformer investigation combines electrical measurements, trending, acoustic localisation and oil analysis. Their case shows why useful electrical evidence may exist without a decisive gas pattern. It does not establish a quantitative sensitivity ranking applicable to every transformer.
For the chemistry, IEC 60599:2022 addresses interpretation in mineral-oil-filled equipment. Its scope does not justify applying mineral-oil diagnostic assumptions unchanged to ester-filled units. Record the fluid and the sampled compartment before consulting the DGA interpretation guide.
Use an Evidence Matrix, Not a Vote Between Tests
The following original framework treats disagreement as an investigation prompt.
| Electrical evidence | DGA evidence | Question to resolve next |
|---|---|---|
| Repeatable PD-like signals after interference review | Rising relevant gases | Do timing, compartment and operating conditions support one mechanism? |
| Repeatable PD-like signals | No convincing gas change | Was the chemistry sensitive to this event and sampling interval? |
| No convincing activity during a short survey | A verified gas trend | Could activity be intermittent, conditions different or the gas source unrelated? |
| Signals not separated from interference | Any gas pattern | Can the electrical measurement support a PD claim at all? |
| Valid electrical result | Missing or censored gas values | What chemical comparison is actually possible? |
Do not count two software labels derived from the same gas sample as two confirmations. Electrical and chemical observations offer different evidence, but that does not establish statistical independence or justify multiplying confidence scores.
Before interpreting signal patterns, retain sensor positions, acquisition settings, synchronisation, measurement duration, background-noise assessment and operating state. Before interpreting the gas trend, retain sampling dates, laboratory method, reporting limits and fluid-treatment history. These are proposed review fields, not an asserted standards checklist.
Worked Example: Rising Hydrogen and a Quiet Survey
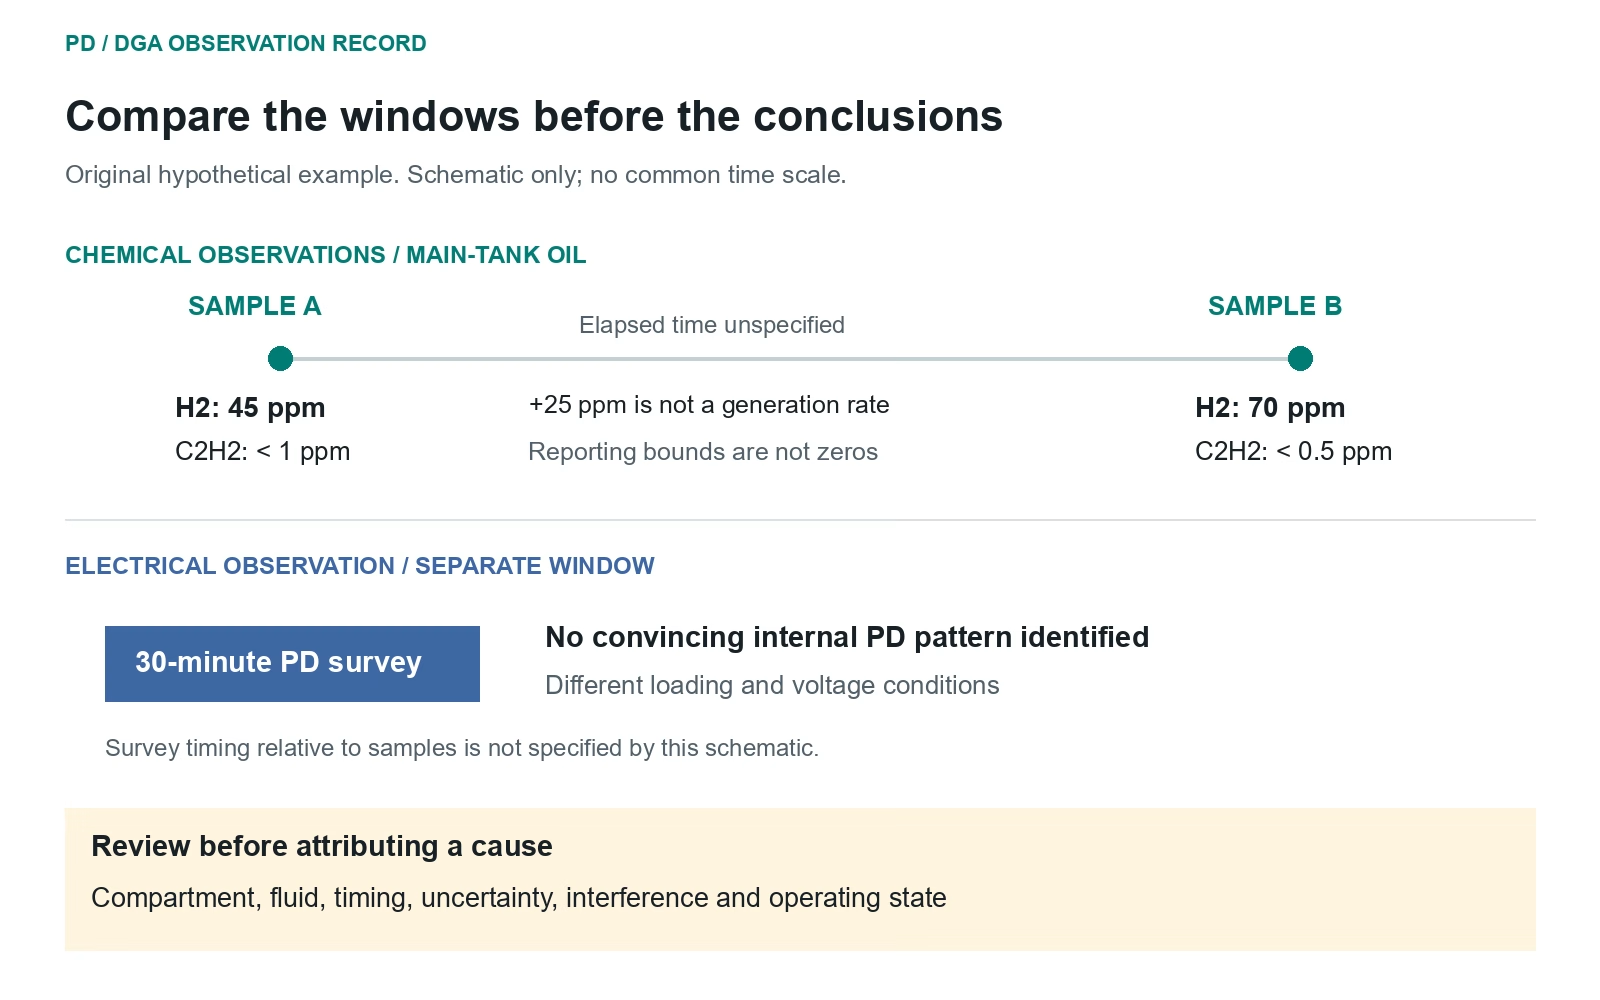
In an original hypothetical case, main-tank hydrogen rises from 45 ppm to 70 ppm across two laboratory samples. Acetylene is reported as less than 1 ppm in the first sample and less than 0.5 ppm in the second. A 30-minute electrical survey finds no convincing internal PD pattern.
The hydrogen difference is 25 ppm, not a rate: the sampling interval has not been specified. Its significance requires laboratory uncertainty, sample quality, timing and the other gases. The acetylene results are different upper reporting bounds, not evidence that the concentration halved. Neither means zero.
The reviewer then discovers that the electrical survey occurred under different loading and voltage conditions from the period associated with the gas samples. It therefore does not directly test every condition that might have produced the chemistry. The defensible statement is that the survey did not identify convincing internal activity during its documented interval.
Verify the gas trend and review treatment and compartment history. Ask the PD specialist whether measurements under relevant conditions could discriminate between the remaining explanations. Hydrogen alone neither locates the source nor uniquely proves PD.
If a later localisation study suggests a region, preserve its uncertainty rather than reporting an exact defect position.
Close the Investigation With Explicit Uncertainty
State which time windows and operating conditions were actually covered, whether interference was resolved, and which gas changes are analytically supported. Assign the remaining question to the responsible engineer, with a defined reason for reassessment.
The Duval Triangle explanation is useful when reviewing gas-pattern interpretation, but a plotted region is not independent electrical confirmation. A non-detection, a missing sample and a measured zero must remain distinct in the assessment record.
Neither test independently establishes a calibrated failure probability or authorises continued operation.
Talk to an engineer about the wider condition-assessment evidence.
Sources and scope: IEC 60270:2025 and IEC 60599:2022, catalogue scopes only; Ranninger and Kruger, Measurement, localization and monitoring of partial discharges on a power transformer, first published January 2021, OMICRON reprint April 2021, full paper reviewed. Sources rechecked 29 September 2026. The matrix and numerical example are original hypothetical aids, not that paper's customer case or a normative decision rule.