Does a higher polarization index mean better insulation in a liquid-filled transformer?
Not necessarily. Polarization index is the ten-minute insulation resistance divided by the one-minute value, and the ratio can rise while both readings fall. Review the timed resistances, temperature, insulation path and instrument range before assigning a condition label, and keep range limits as inequalities rather than exact ratios. PI does not directly measure paper moisture, degree of polymerisation or remaining service years.
A higher polarization index does not necessarily mean better transformer insulation. The ratio can rise while both underlying resistance readings fall. For a liquid-filled transformer, review the timed resistances, temperature, measured insulation path and instrument range before assigning a condition label from PI alone. A generic motor or cable classification is not an adequate substitute for that assessment.
Read the Resistance Curve Before the Ratio
Polarization index, PI, is the insulation resistance at ten minutes divided by the resistance at one minute. Both readings must belong to the same valid test. A one-minute spot reading cannot be relabelled as a PI test, and a predicted endpoint should remain distinguishable from a measured ten-minute result.
Megger's insulation-resistance Q&A cautions that the oil-cellulose system complicates interpretation. Alan Purton's Modern ART paper, page 4, illustrates how liquid conductivity can undermine a simple PI classification. Its generic bands are not adopted here.
Request the resistance-versus-time record, actual test voltage, connection diagram, temperature and instrument range. Check whether voltage remained stable and whether the two timed values were measured within range. Retaining only the quotient removes information needed to understand the result.
Residual charge, connected equipment and guarding arrangements also affect comparability. Testing, isolation and discharge belong to a qualified team using its approved safety procedure; this article is a report-review framework, not test instructions.
Three Comparisons Worth Making
Compare the same insulation path, retain both timed readings and select corroborating evidence for the suspected mechanism. This original review table supplies no universal limits.
| Result presented | What can be concluded now? | What is still needed? |
|---|---|---|
| PI only | A ratio has been reported | Both timed resistances and the test record |
| Low PI with high, stable absolute resistance | Limited time dependence was measured | Insulation-system context and historical comparison |
| High PI with much lower absolute resistance than before | The quotient increased while another observation worsened | Review temperature, leakage paths and corroborating evidence |
| Ten-minute value exceeds instrument range | Only a lower bound may be available | Preserve the inequality; do not invent an exact ratio |
| Large change after a connection or guarding change | Different specimens may have been measured | Reconstruct the two circuits before trending |
IEEE C57.152-2025 covers field diagnostics for liquid-filled transformers and advocates joint interpretation of tests. Only its official catalogue scope was reviewed here; no numerical PI criterion is attributed to it.
Worked Example: A Better PI, a Worse Absolute Reading
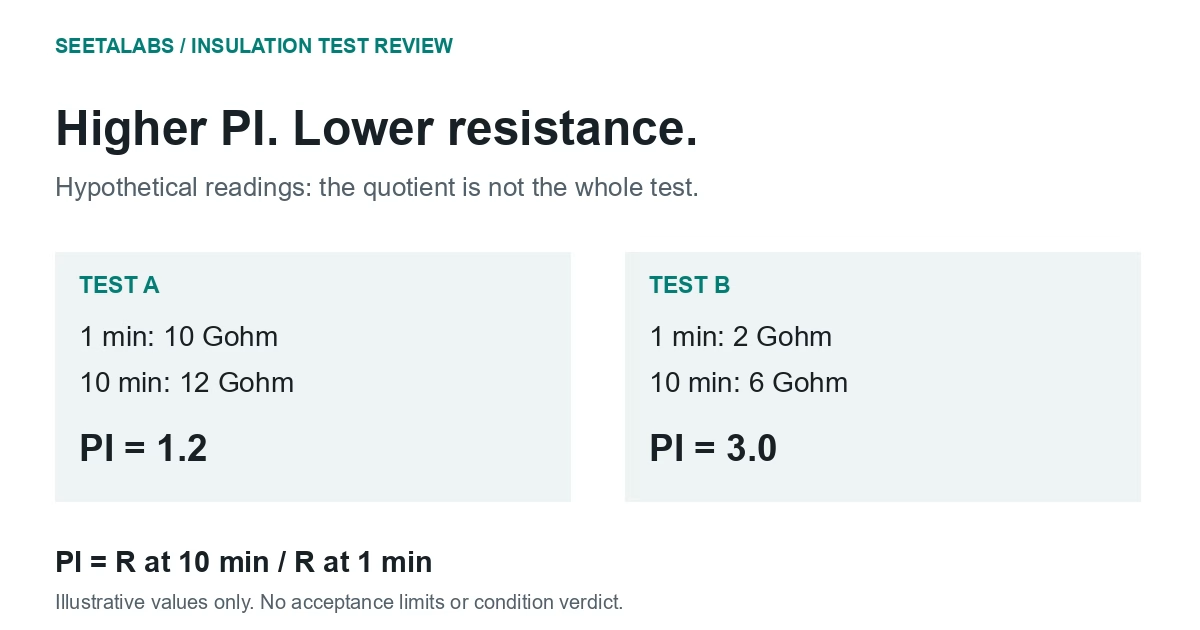
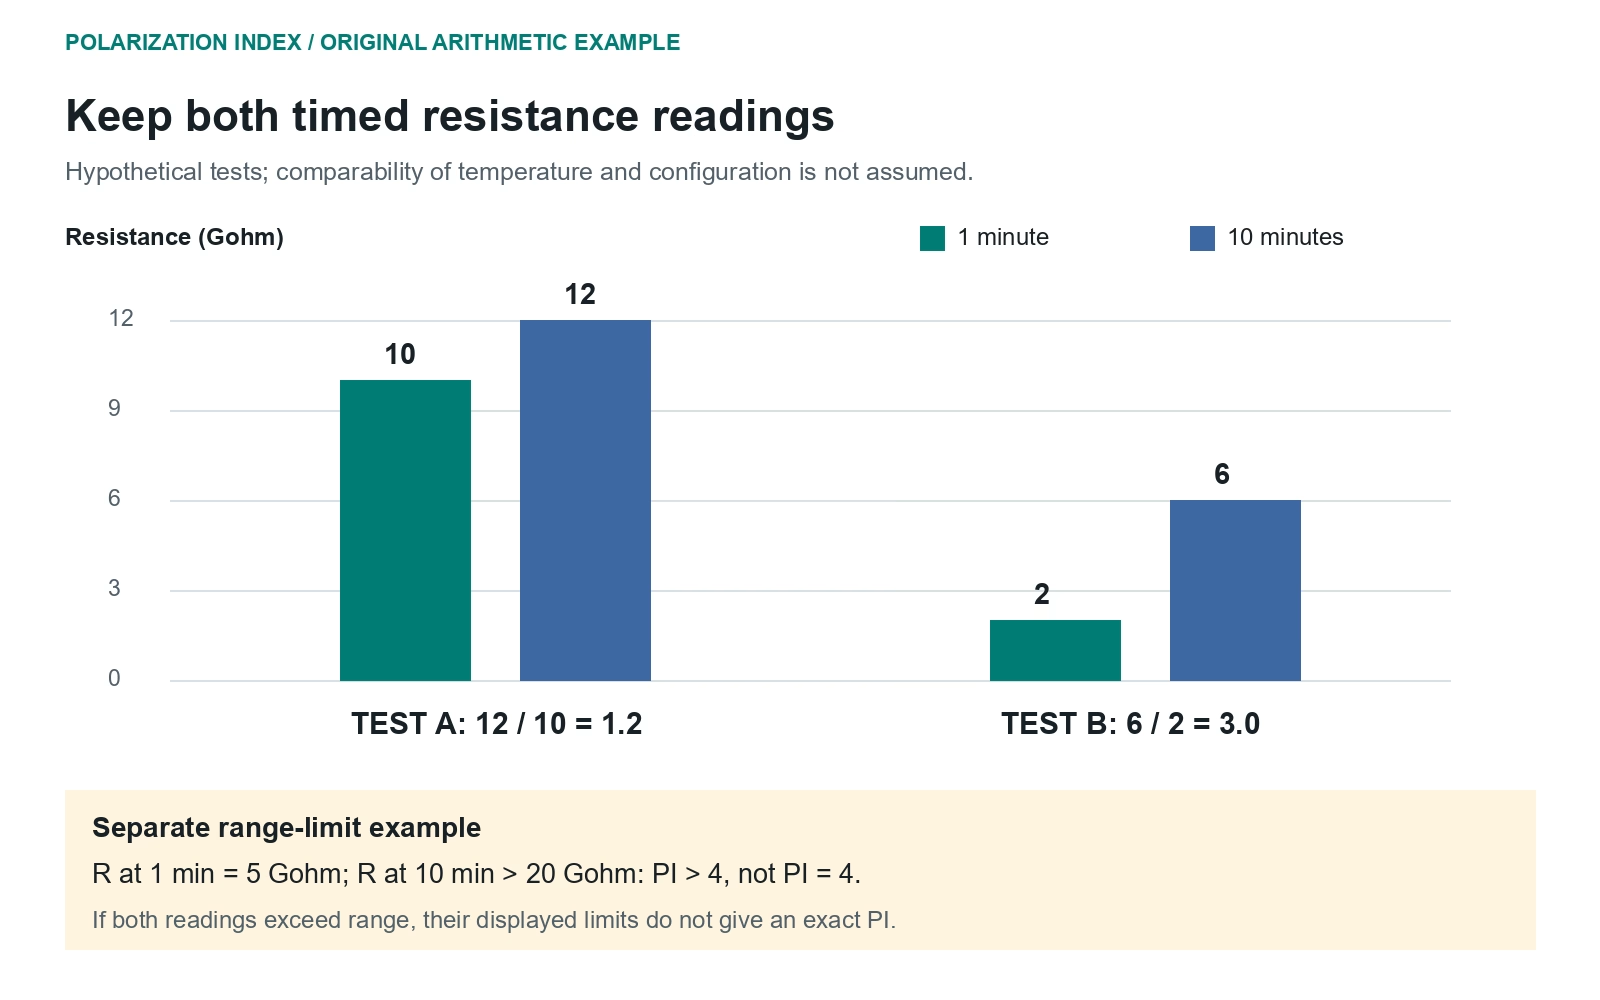
Consider two invented tests of the same transformer. In the first, the one-minute resistance is 10 Gohm and the ten-minute resistance is 12 Gohm. PI is 1.2. In the second, the readings are 2 Gohm and 6 Gohm. PI is 3.0.
A dashboard displaying only PI suggests improvement. The underlying measurements show that both timed resistances fell. Neither observation establishes deterioration without checking temperature and configuration, but the "improvement" conclusion is plainly unsupported by the quotient alone.
Request the full curves and verify the specimen and conditions. If these cannot be reconstructed, retain two non-comparable tests rather than a trend.
Now consider a separate range-limit case. If the one-minute reading is 5 Gohm and the ten-minute reading is recorded as greater than 20 Gohm, the evidence supports PI greater than 4, assuming a valid test. It does not support PI equal to 4. If both readings exceed range, an exact PI cannot be calculated from the displayed values.
These are arithmetic examples, not acceptance bands.
Write a Conclusion That Matches the Evidence
State the insulation path and whether comparison is valid. Report absolute resistance, curve behaviour, PI and range limits separately. Missing readings are not zero; missing temperatures are not evidence of a match.
For liquid-filled units, retain the actual fluid type and any fluid replacement history. Do not transfer mineral-oil interpretation or correction assumptions to natural or synthetic esters without a validated basis. PI does not directly measure paper moisture, degree of polymerisation or remaining service years.
Preserve these qualifications in condition monitoring and any health-index assessment.
Talk to an engineer about reviewing the evidence.
Sources and scope: IEEE C57.152-2025, catalogue scope only; Megger, Q and A: Insulation Resistance Testing, 2019; Alan Purton, Modern ART (Accuracy in Resistance Testing), 2014, sections II-III. Sources rechecked 29 September 2026. Numerical cases and review table are original, not acceptance criteria.