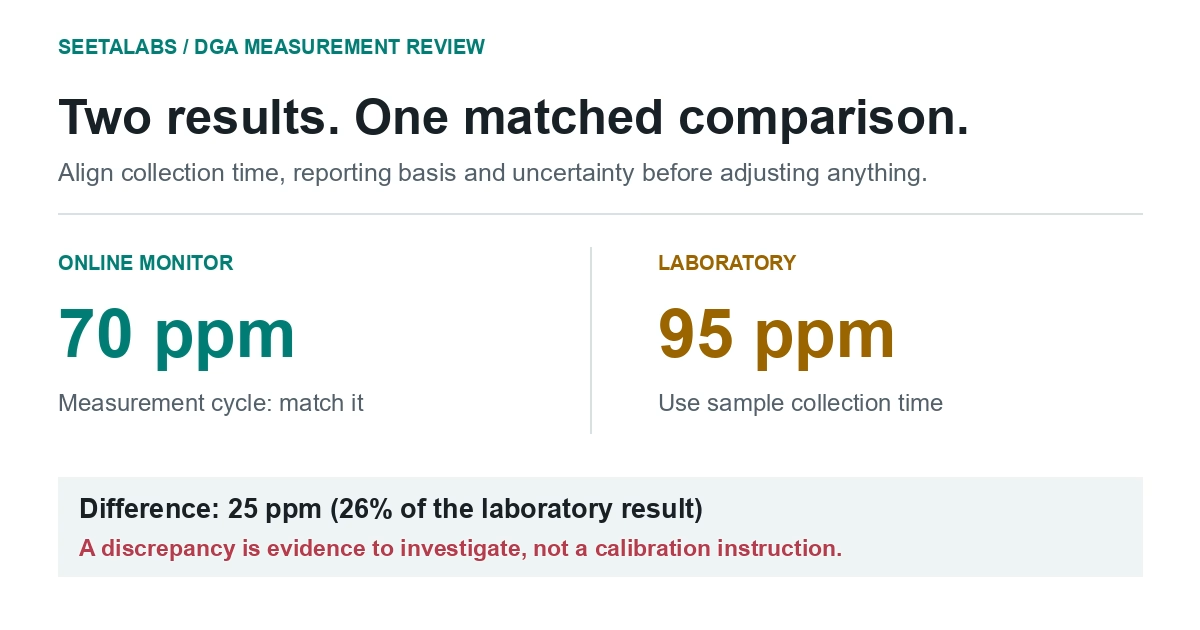

The monitor reports 70 ppm hydrogen on Monday morning. A laboratory report issued on Thursday says 95 ppm. Before concluding that either system is wrong, find the collection time on the laboratory report. If the bottle was drawn the previous Friday, the two numbers may describe different conditions.
Start by aligning collection time, measurement cycle and reporting basis. A discrepancy is not, by itself, a reason to adjust the monitor's calibration.
Compare the same observation as closely as possible
Use the laboratory sample collection time, not receipt or report time. Record the online instrument's measurement cycle and the timing of oil circulation to it. Select the corresponding monitor observation or explain the averaging window used.
Confirm the sampled compartment, ports, fluid and units. Check how gas volumes are referenced: two reports both labelled ppm can still use different reference conditions. Ask the laboratory and monitor supplier for their actual reporting basis rather than applying a remembered conversion indiscriminately.
The OEM technical note Understanding the uncertainties of DGA monitoring discusses sampling, extraction, calibration references and reporting conventions. It also distinguishes repeatability from overall measurement performance: closely repeated readings can still share a bias. These are checks to make for the actual instrument and laboratory, not specifications transferable between manufacturers.
Let the pattern of disagreement guide the check
| Observed pattern | Hypothesis worth testing | Evidence to collect |
|---|---|---|
| Similar proportional difference across gases | Reporting basis or calibration-scale difference | Reference conditions and calibration records |
| Laboratory hydrogen lower, atmospheric gases altered | Air exposure or sample-handling problem | Sampling notes, vessel condition, oxygen/nitrogen history |
| One channel diverges repeatedly | Gas-specific performance or extraction issue | Channel quality flags and uncertainty at that level |
| Differences appear after service work | Changed installation, method or settings | Service chronology and configuration record |
| Agreement returns when timestamps align | Sampling interval or instrument-response mismatch | Raw timestamped history and measurement cycle |
| Both sources vary without a stable relationship | Real process changes or inconsistent sampling | Matched repeats and operating-event records |
The table lists hypotheses, not automatic diagnoses. IEEE C57.104-2019, Clauses 5.1.4 and 5.2.1, addresses sample contamination and analytical reliability; Annex B cautions against rate calculations from incompatible sources. Preserve both reports until the discrepancy is explained.
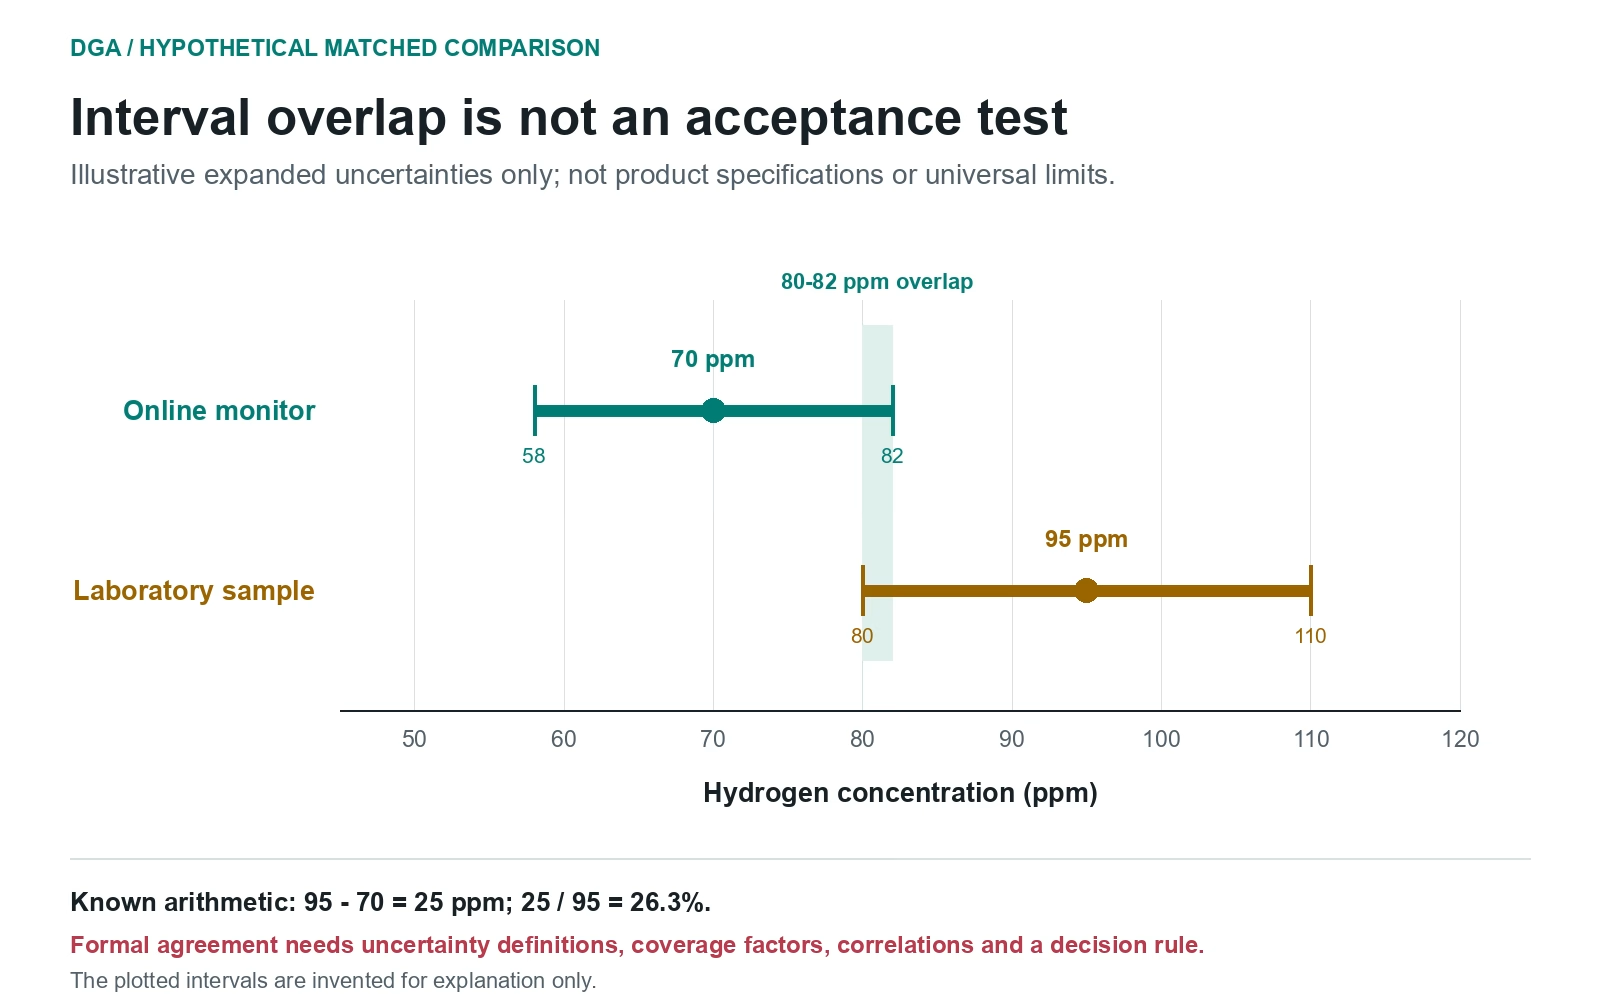
A hypothetical matched comparison
Assume the timestamp problem is resolved. A monitor measures 70 ppm hydrogen and a matched laboratory sample reports 95 ppm. The absolute difference is 25 ppm; relative to the laboratory value, it is about 26%. Changing the denominator would change the percentage, so state which convention is used.
Suppose, purely for illustration, that the supplier and laboratory provide expanded uncertainties of plus or minus 12 ppm and plus or minus 15 ppm for those conditions. The resulting intervals are 58-82 ppm and 80-110 ppm: they overlap between 80 and 82 ppm. That geometric overlap is not an acceptance test.
A formal comparison needs the uncertainty definitions, coverage factors, relevant correlations and a decision criterion suited to the purpose. Until these are known, the defensible numerical statement is the 25 ppm difference, not "within tolerance." The invented intervals are neither product specifications nor universal acceptance limits.
Repeat matched comparisons across relevant conditions. A persistent directional offset suggests a different investigation from one isolated discrepancy. Preserve individual gas results: an acceptable total combustible-gas sum can hide offsetting channel errors.
Build a useful discrepancy report
Attach the original laboratory report, matched online data, collection and measurement timestamps, sampling location, fluid identity, relevant service records and gas-specific quality flags. Request the uncertainty applicable at the measured concentrations, including low-level reporting conventions.
Separate the metrology question from the transformer question. You may be uncertain about the exact concentration while both sources show a developing rise. Conversely, a stable source offset need not imply increasing activity in the asset. Independent alarms or protection events must retain their own significance while the measurements are reconciled.
IEC 60567:2023 addresses sampling of free gases and analysis of free and dissolved gases. IEC 60475:2022 addresses sampling insulating liquids. Their public scopes were checked; detailed sampling or analytical requirements from their full texts are not asserted here.
Request a matched-data review from the laboratory and monitor supplier before applying an offset. Keep source labels in the condition-monitoring history so the subsequent DGA assessment can distinguish a measurement-source change from a transformer change.
References: IEEE C57.104-2019, Clauses 5.1.4, 5.2.1 and Annex B; the linked OEM technical note (2020); IEC 60567:2023 and IEC 60475:2022, public scope only. Relevant passages reviewed as of 25 September 2026. Example numbers are hypothetical; no instrument acceptance test was performed.