Improve your fleet performance and boost the transformer uptime with an all-new and powerful add-ons from Seetalabs Ronin to mitigate all your remote fleet management demands .
What is approximate fleet behavior (AFB)?
As the name suggest, approximate fleet behavior shows the way each transformer in a fleet behaves. This “behavior” is synomous to its overall health condition that is given by its health index score. It is obvious that all transformers in a fleet (or a group) shall not behave identically. Some might have a lower reliability risk than others. But to know how unequally they are behaving is a major challenge for asset managers. Therefore, we have developed an engineering and mathematical logic to solve such challenges and improve the overall fleet performance.
How to use AFB for detecting fleet performance?
To use the AFB tool, firstly you must be logged inside the RONIN-Dashboard environment with an active license and credentials. Then, go to the left side menu bar and drop down to “Fleet Management”. On the top of the screen, you will find the “Add fleet” button. Create a label for your fleet using alphanumeric and special characters. Once your fleet is created, go on to add the assets that belong to this fleet. Click here for step-by-step instructions.
How can AFB improve fleet performance?
The image given below is an approximate behavior of a fleet containing 100 transformers. Some assets of this fleet are very good with long life expectency, while few are almost dead. The latest AFB tool will help you identfy key information about your fleet without any data management hussle.
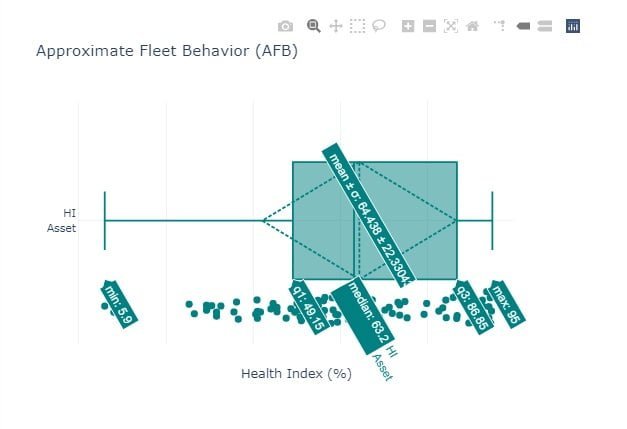
For example, the minimum health index score in this fleet is 5.9%, whereas the maximum is 95%. The weighted average or mean of this fleet is 64.438% as evident from the label with a variance of approximately 22.3. This means that the average variance between the actual health index of an asset and the mean is about +/-22.3 units, give or take. Similarly, the median of this fleet is 63.2% which is the mean of fiftieth and fifty first value because it contains even number of data samples.
Now, the bottom half of this data would mean all value points that are below 63.2%, while the top half contains value points between 63.2% and 95% . If we hover over the dots, the exact asset ID along with exact individual health index can also be observed.
The most interesting part of this image are the q1 and q3 labels. Essentially, the whole dataset is broken into three quarters such that these labels can represent the first and third quartile respectively of the whole fleet. First quartile or q1 is 49.15 as the median of the bottom half; whereas, the third quartile or q3 is 86.85 as the median of the top quarter of this data.
What is the take away?
As an asset manager, the fleet management feature will let you know the percentage of transformers that needs immediate attention. You must take a quick look into other tests of these assets and take an appropriate action. And this entire activity takes less than a minute!
If you wish to learn more about RONIN then watch this video or mail us at info@seetalabs.com