
An outage-cost estimate should change when partial restoration changes what the plant can produce. Pricing every hour at full production loss can overstate one scenario; ignoring scrap and restart costs can understate another. Start with the recovery sequence, then attach costs to it.
The result is exposure if the specified interruption occurs. It is not annual expected loss, and a transformer health index is not the probability needed to make that conversion.
Calculate full and partial restoration separately
Consider a hypothetical plant with EUR 7,500 of unrecoverable contribution lost per hour of complete production interruption. A further EUR 60,000 covers one-off scrap and restart costs, with no overlap. Finance has defined the contribution measure after the relevant avoided costs. Neither amount is an industry benchmark.
For 12 hours without useful production, the calculation is:
12 x EUR 7,500 + EUR 60,000 = EUR 150,000.
Now assume a technically feasible temporary arrangement restores half of the affected production contribution after hour four. The remaining eight hours lose EUR 3,750 per hour:
4 x EUR 7,500 + 8 x EUR 3,750 + EUR 60,000 = EUR 120,000.
The modelled reduction is EUR 30,000 before the temporary arrangement's own cost. If its all-in incremental cost is EUR 18,000, the comparison becomes EUR 138,000 against EUR 150,000: a conditional reduction of EUR 12,000.
These totals cover the stated production-related boundary; asset repair and other unpriced consequences are outside it.
This does not establish an annual saving or justify purchasing the arrangement on its own. Availability, compatibility and actual process recovery still need evidence. Half the available electrical capacity does not necessarily restore half the contribution.
Prevent double counting
Use one agreed boundary: the asset owner, the customer or the wider system. CIGRE TB 962:2025, Section 6.2.2, printed pages 147-148, distinguishes equipment damage, business interruption and other contextual costs.
| Cost line | Include | Check before adding |
|---|---|---|
| Lost contribution | Output that cannot be recovered later, using the agreed margin | Do not add sales revenue for the same output |
| Scrap and restart | Identified material, labour and consumables | Remove costs already included in the hourly term |
| Temporary supply | Mobilisation, installation, hire and operation | Reduce production loss only for the output it actually restores |
| Equipment restoration | Repair, transport, site work and testing | Do not mix this with business interruption |
| Contract exposure | Applicable obligations reviewed by the contract owner | Avoid counting the same compensation twice |
State when the interruption clock stops. Transformer energisation, supply restoration and acceptable production can occur at different times.
Show which duration matters
Keeping the example's full-loss rate and fixed cost unchanged gives EUR 105,000 at six hours and EUR 240,000 at 24 hours. These are alternative scenarios, not a statistical confidence interval.
Use the comparison to investigate the recovery step that controls duration: obtaining a replacement bushing, mobilising a compatible spare, completing tests or restarting the process. A better duration estimate can matter more than another decimal place in the hourly rate.
A regional blackout needs a different boundary. Sue Wing and colleagues' 2025 open-access study examines economy-wide consequences and customer responses to widespread, prolonged interruptions. Its discussion highlights context and double-counting difficulties; its regional results are not coefficients for this plant example.
Do not invent likelihood to complete the spreadsheet
Annual expected loss requires defensible probabilities for defined events over a stated period. CIGRE TB 761:2019, Chapter 7, pages 55-57, discusses the difficulty and calibration needs of such estimates.
Our health-index guide explains why condition scores cannot fill that probability cell. Keep the condition evidence and the consequence scenario linked but distinct.
Ask finance and operations to verify the contribution boundary and the partial-restoration assumption before refining the total. Show safety, environmental and essential-service consequences separately where a defensible monetary estimate is unavailable. Do not assign them zero.
Talk to an engineer about the condition evidence supporting that review.
Sources and scope: CIGRE TB 962:2025, Section 6.2.2, printed pages 147-148, and TB 761:2019, Chapter 7, pages 55-57: targeted licensed passages reread on 29 September 2026, not full-brochure readings. Sue Wing et al., Nature Communications 16, 3335 (8 April 2025): public introduction, results passages and discussion including limitations read on that date. No regional coefficients are reused. The cost model and all amounts are original hypothetical examples.
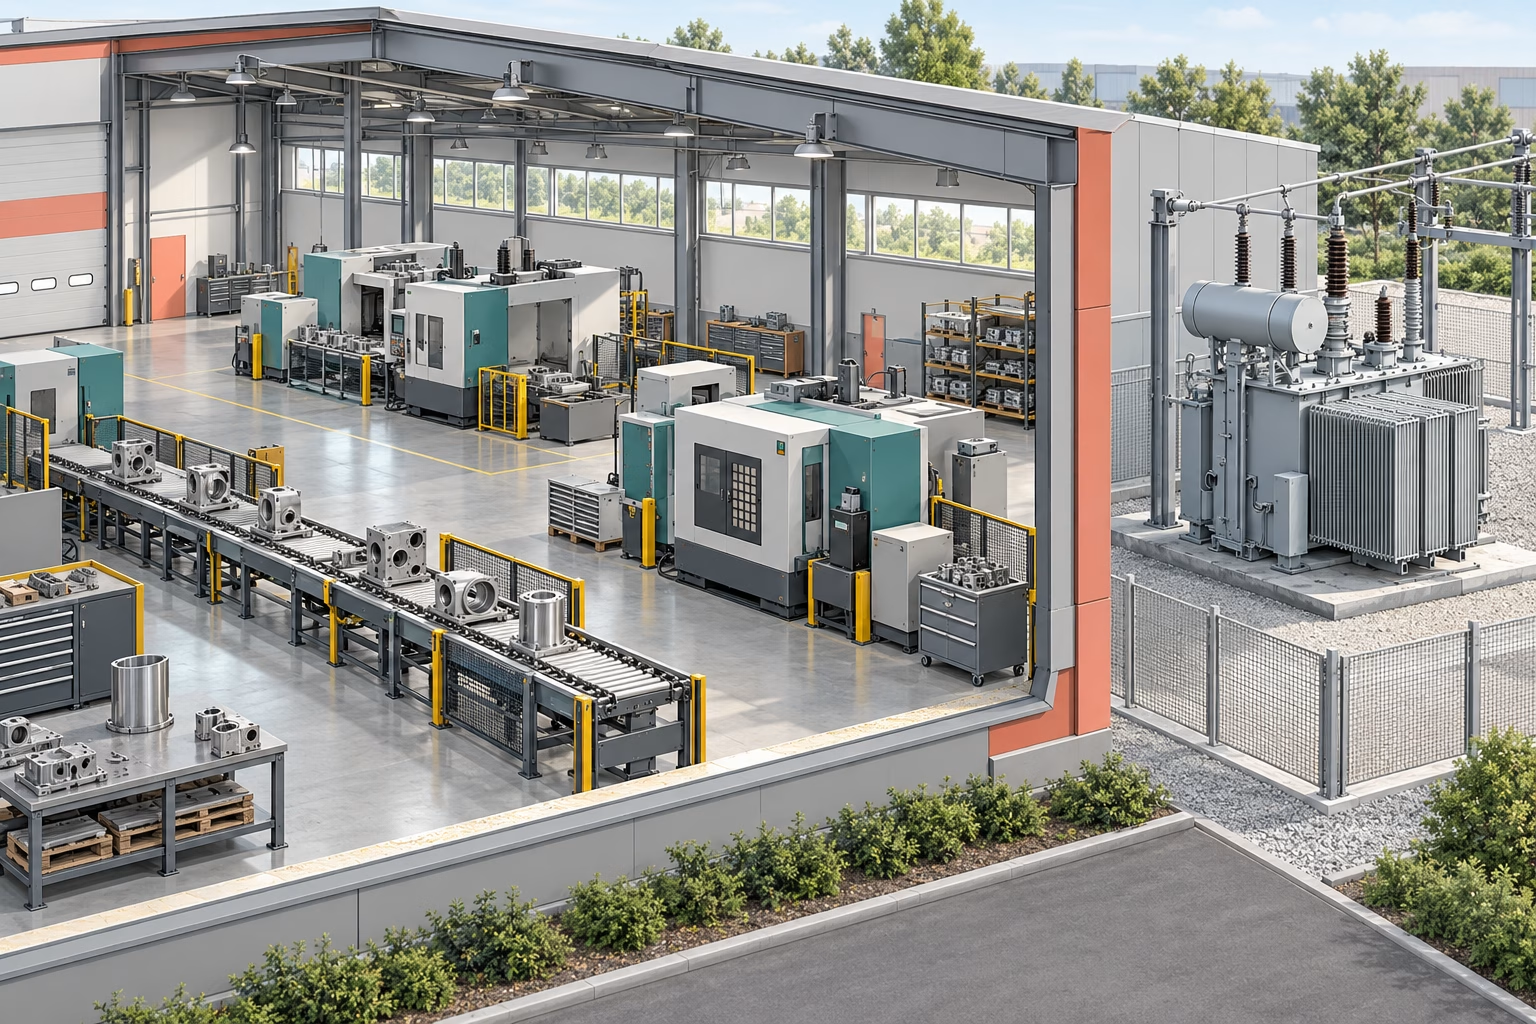
Cover: AI-generated illustration of a generic production hall and transformer. Not a real outage, customer installation or validated facility layout.