
Renewable plant transformer monitoring needs asset-level duty records, not just plant energy totals. A solar-plus-storage block may transfer battery power after solar export ends; its collector and grid-connection transformers serve different loads. Connect each asset's role to time-aligned electrical, thermal, maintenance and condition evidence before interpreting a change.
This article provides an original evidence-collection framework for owners of solar, wind and hybrid plants. It does not offer a universal renewable-duty alarm setting or infer remaining life from a load graph.
Identify the Transformer Before Selecting the Method
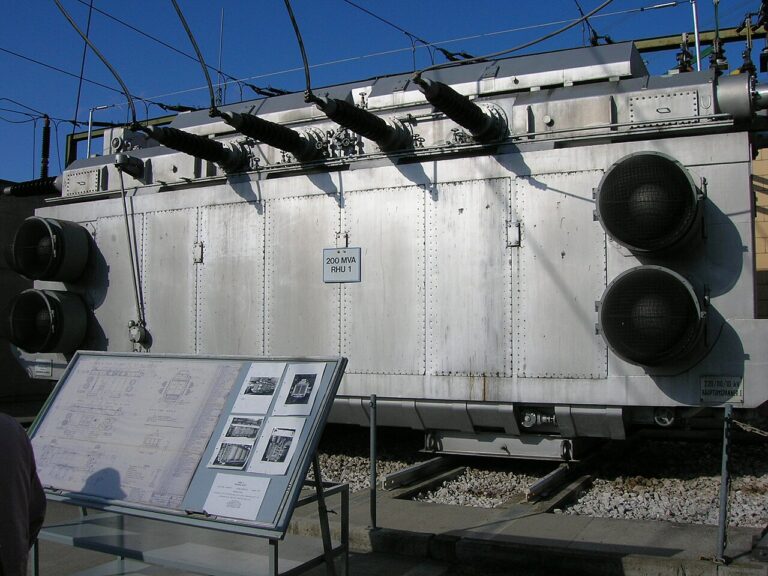
Record whether the asset serves a turbine, inverter block, collector system, grid connection or auxiliary supply. Identify liquid or dry-type construction, cooling arrangement, rating, relevant design documentation and available measurements. Check whether plant modifications changed the duty assumed at procurement.
IEC/IEEE 60076-16:2018 addresses dry-type and liquid-immersed wind-turbine step-up transformers within its stated voltage scope, up to and including 72.5 kV highest voltage for equipment. It distinguishes these from transformers connecting several turbines to the wider network. The name of the wind farm does not make every transformer a Part 16 asset.
IEC 60076-7:2018 is a loading guide for mineral-oil-immersed transformers. Its scope includes ambient conditions, loading, temperature and thermal ageing. Applying a thermal model still requires suitable asset parameters; a generic plant load curve cannot establish winding hot-spot temperature by itself.
For inverter applications, Hitachi Energy describes harmonics, switching behaviour and cyclic loading as design considerations for its power-conversion transformer portfolio. This is useful OEM context, not evidence that every renewable plant has the same stresses. Hitachi Energy solar and storage transformer information.
Build an Evidence Map Around the Engineering Question
Match each question to a measurement and a known limitation. The following table is a proposed investigation aid, not a prescribed monitoring package.
| Engineering question | Evidence to align | What the evidence cannot establish alone |
|---|---|---|
| Does temperature change follow load or cooling state? | Current, ambient, oil temperature, cooling status and timestamps | Winding hot-spot without a validated measurement or model |
| Did hybrid operation change duty? | Charge/discharge periods, current, voltage and operating modes | Insulation deterioration from dispatch history alone |
| Is power quality relevant to an observed concern? | Suitable waveform or harmonic measurements and design limits | Harmonic content from low-resolution active-power totals |
| Did a gas change follow an intervention? | DGA sample dates, oil work, switching and operating records | A unique fault cause from temporal coincidence |
| Is the apparent quiet period real? | Sensor availability and communications logs | Good condition during an unobserved interval |
Do not use plant MW alone as a proxy for transformer current. Under a simplified balanced three-phase sinusoidal assumption, apparent power is the square root of active power squared plus reactive power squared. If the question concerns harmonics or unequal phases, that simplification needs additional measurements.
Keep the electrical records tied to the specific transformer. Plant totals can conceal how duty is divided among blocks, while a collector outage can alter the loading of remaining paths.
Work Through a Hybrid-Plant Example
Consider a hypothetical mineral-oil transformer serving a solar-plus-storage block. At one steady operating point, total three-phase active and reactive power at the same transformer terminal are 4 MW and 3 MVAr. Under the balanced sinusoidal assumptions above, S = sqrt(P^2 + Q^2) = sqrt(4^2 + 3^2) = 5 MVA, and the magnitude of power factor is 4/5 = 0.8. Reviewing only the 4 MW value would omit part of the electrical loading picture.
These inputs must describe the same operating point, not a daily maximum MW combined with a maximum MVAr recorded at another time. The 5 MVA result is neither a nameplate rating nor evidence that the duty is permissible. Voltage and winding-current records, cooling, duration, prior load and the applicable design limits are still needed for that assessment.
In this example, grid charging at night reverses active power relative to the daytime export convention. Not every solar-plus-storage layout sends charging power through the same transformer, so verify the actual path and meter sign convention. Reversal alone does not establish damage or a thermal problem. The engineer needs current, voltage, cooling state, ambient conditions and the transformer's relevant design information to assess the duty.
Two oil samples are available, one before and one after a cooling-system repair. A gas concentration changes between them. The engineer marks the repair and sampling dates on the operating record, checks laboratory comparability, and looks for supporting evidence. The timing suggests questions to investigate; it does not prove the repair caused the change.
Use the DGA guide for interpretation context. If the asset uses an ester, do not apply mineral-oil diagnostic limits by default. If it is dry-type, an oil-sampling workflow is inapplicable. Missing gas results and below-detection qualifiers also remain distinct from zero.
The useful output is a bounded finding: what duty was observed, what condition evidence changed, which explanations remain plausible, and what measurement would distinguish them. No exact remaining-life estimate follows from this example.
Choose the Next Measurement Before Adding Sensors
First list the signals already retained by plant controls, the laboratory and maintenance records. Check their timestamps, retention periods, sampling intervals and asset associations. A missing time zone or an unexplained clock shift can undermine an otherwise useful comparison.
Preserve original timestamps and document any clock correction. Mark gaps and distinguish measured values from modelled or interpolated points. Coarse averages can hide short excursions; choose the recording resolution for the question rather than assuming a monthly energy total describes thermal or harmonic duty. Do not interpolate through an outage and present the reconstructed interval as observed.
Then identify the decision each additional measurement would support. If a power-quality question needs waveform detail, a monthly energy total will not answer it. If an intervention date is missing, another dashboard may be less useful than the completed work order.
The broader condition monitoring resources can help organize this evidence. Decisions about loading and operation still require the responsible engineers, applicable design information and the owner's procedures.
Begin with one transformer and one unresolved question. Assemble a synchronized evidence pack before extending the approach across the plant. Talk to an engineer about the laboratory and operating evidence needed for that question.
Sources and Scope
- IEC/IEEE 60076-16:2018 and IEC 60076-7:2018, both edition 2: official public scopes and publication metadata checked; full-text design, thermal coefficients and loading limits not reviewed for this article.
- Hitachi Energy solar and storage transformer information: OEM description of its application considerations.
Evidence checked through 30 September 2026. The evidence map and hybrid-plant example are original and illustrative, not measured plant results, loading permission or a remaining-life estimate.
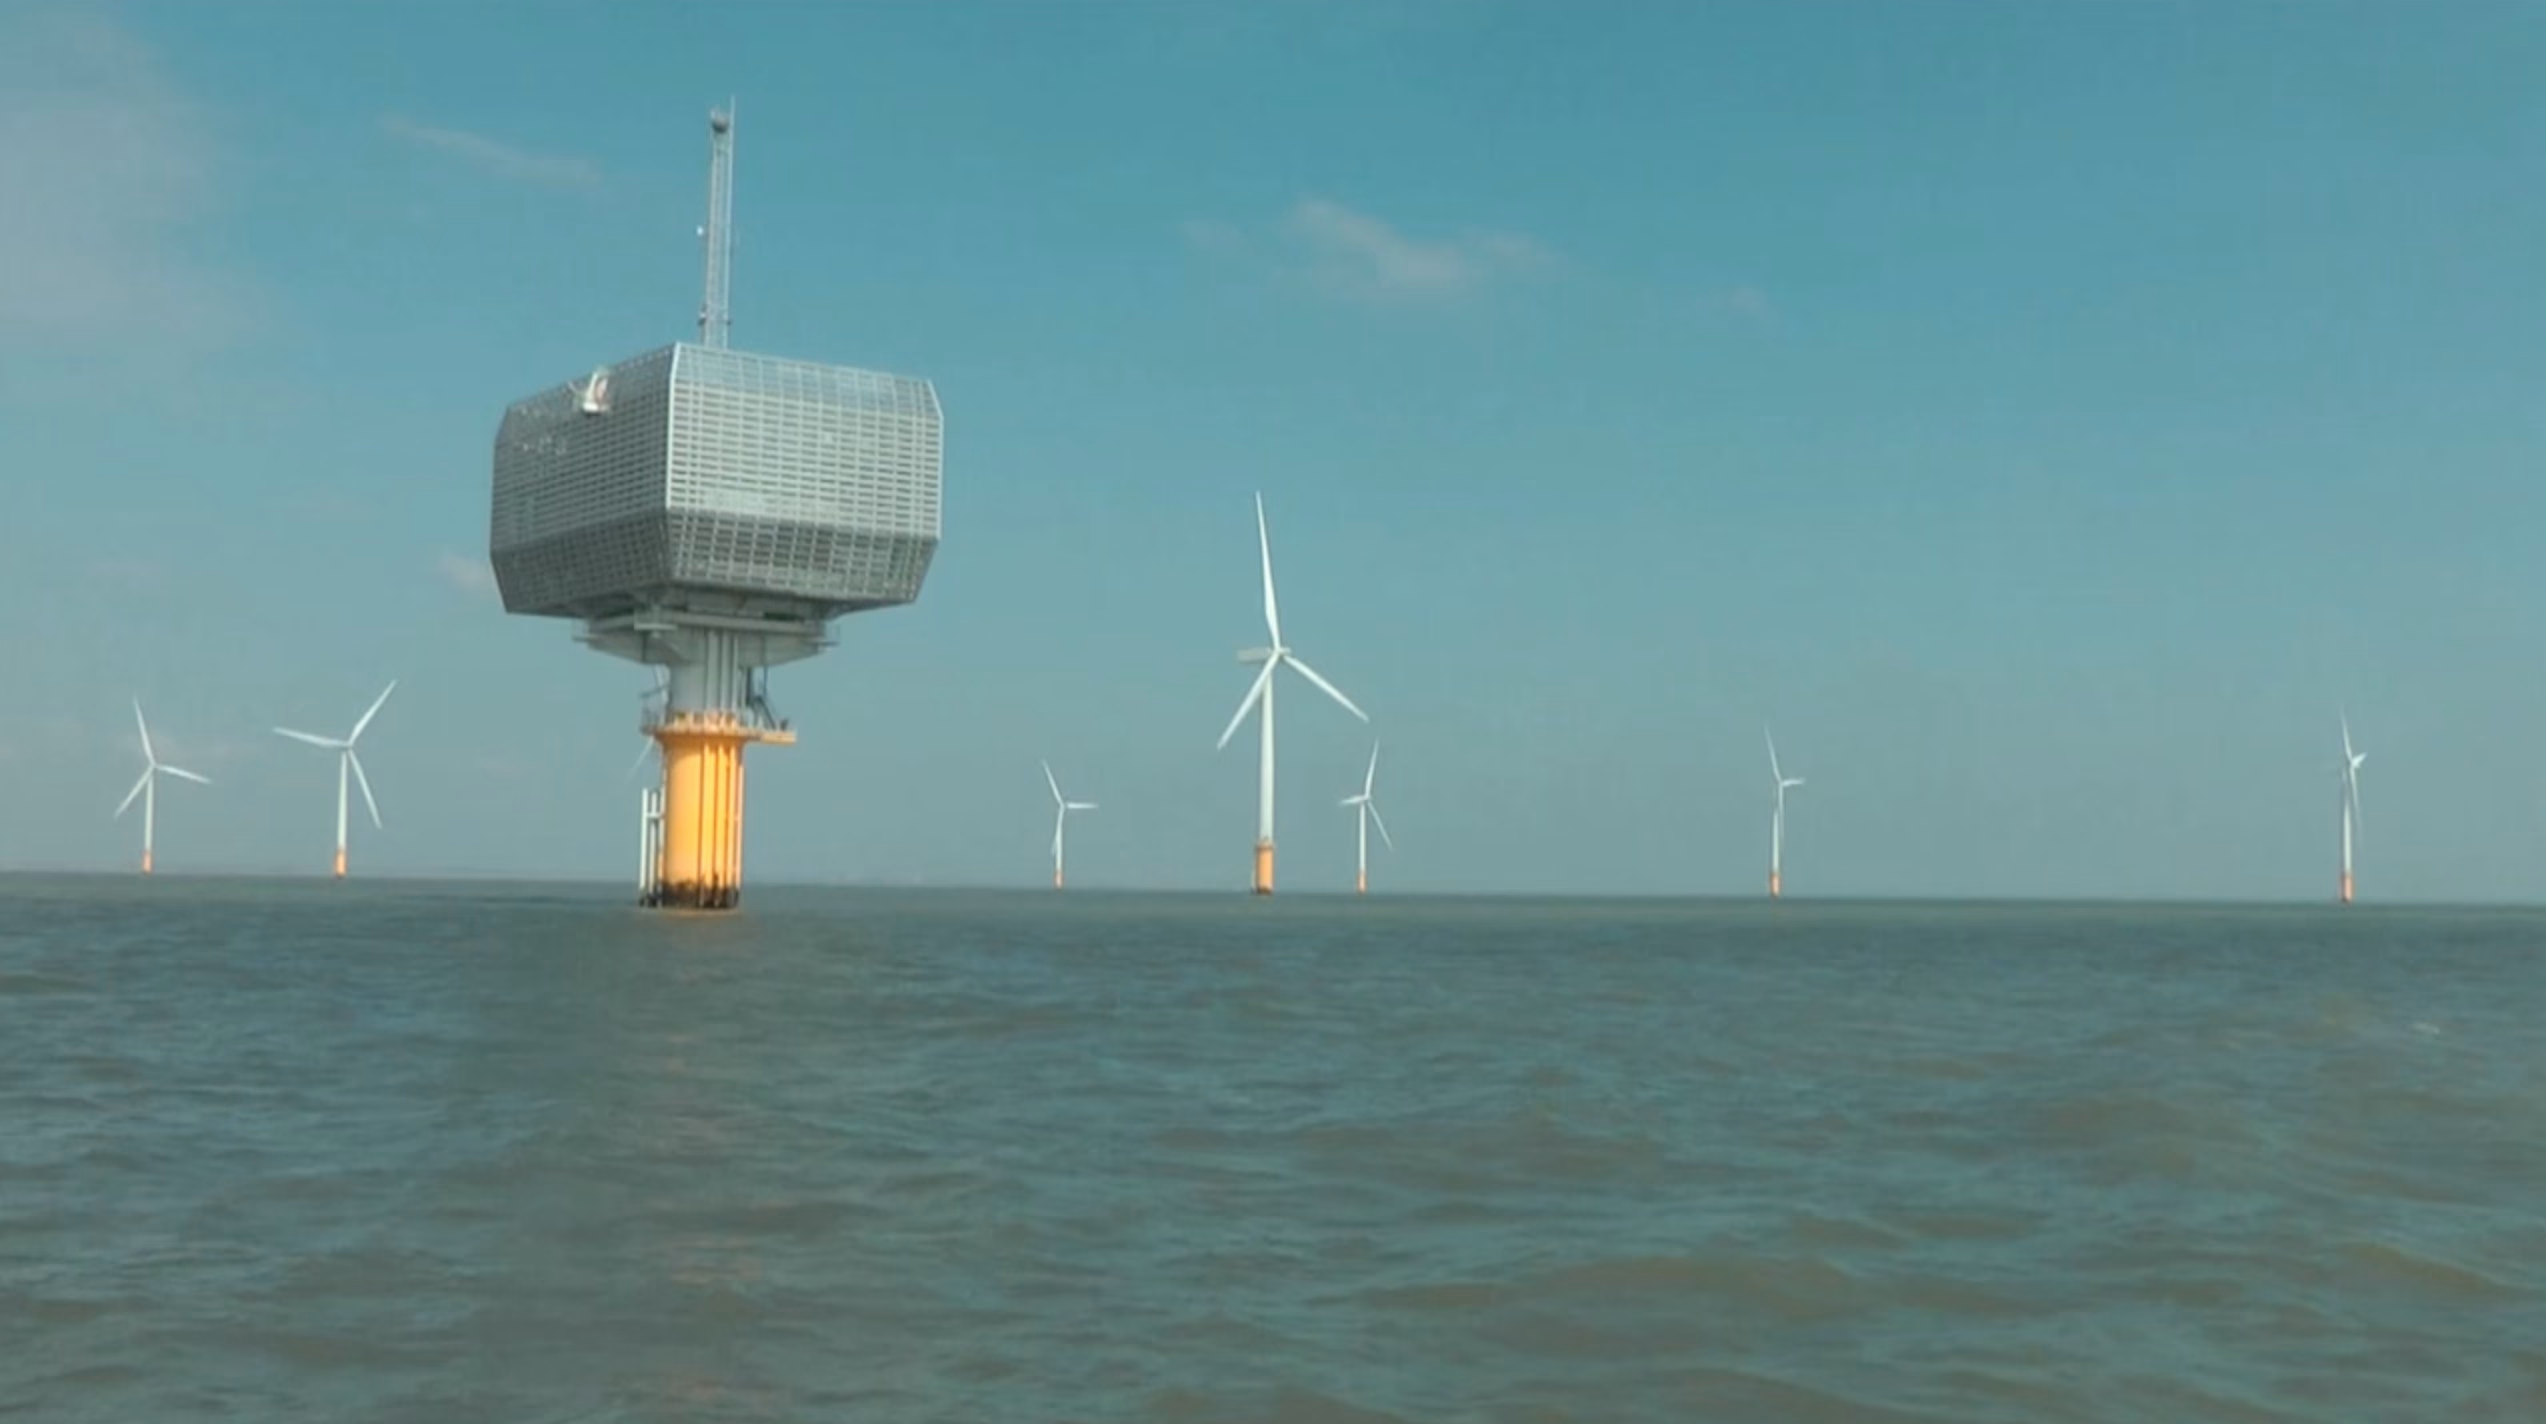
Cover photograph: Gunfleet Sands offshore substation and wind farm, photographed in 2017. Photo: Ashley Coates / Wikimedia Commons, CC BY-SA 2.0. Original photograph, no editorial alteration. Illustrative location, not a Seetalabs customer case.